

Our Blog
Take a walk on the land beside a member of Agraria staff! Our blog offers a mix of ecological learning, personal and poetic reflection, and lively storytelling around projects and happenings at Agraria, all written by staff contributors.
Search our blog

Luminous Presence
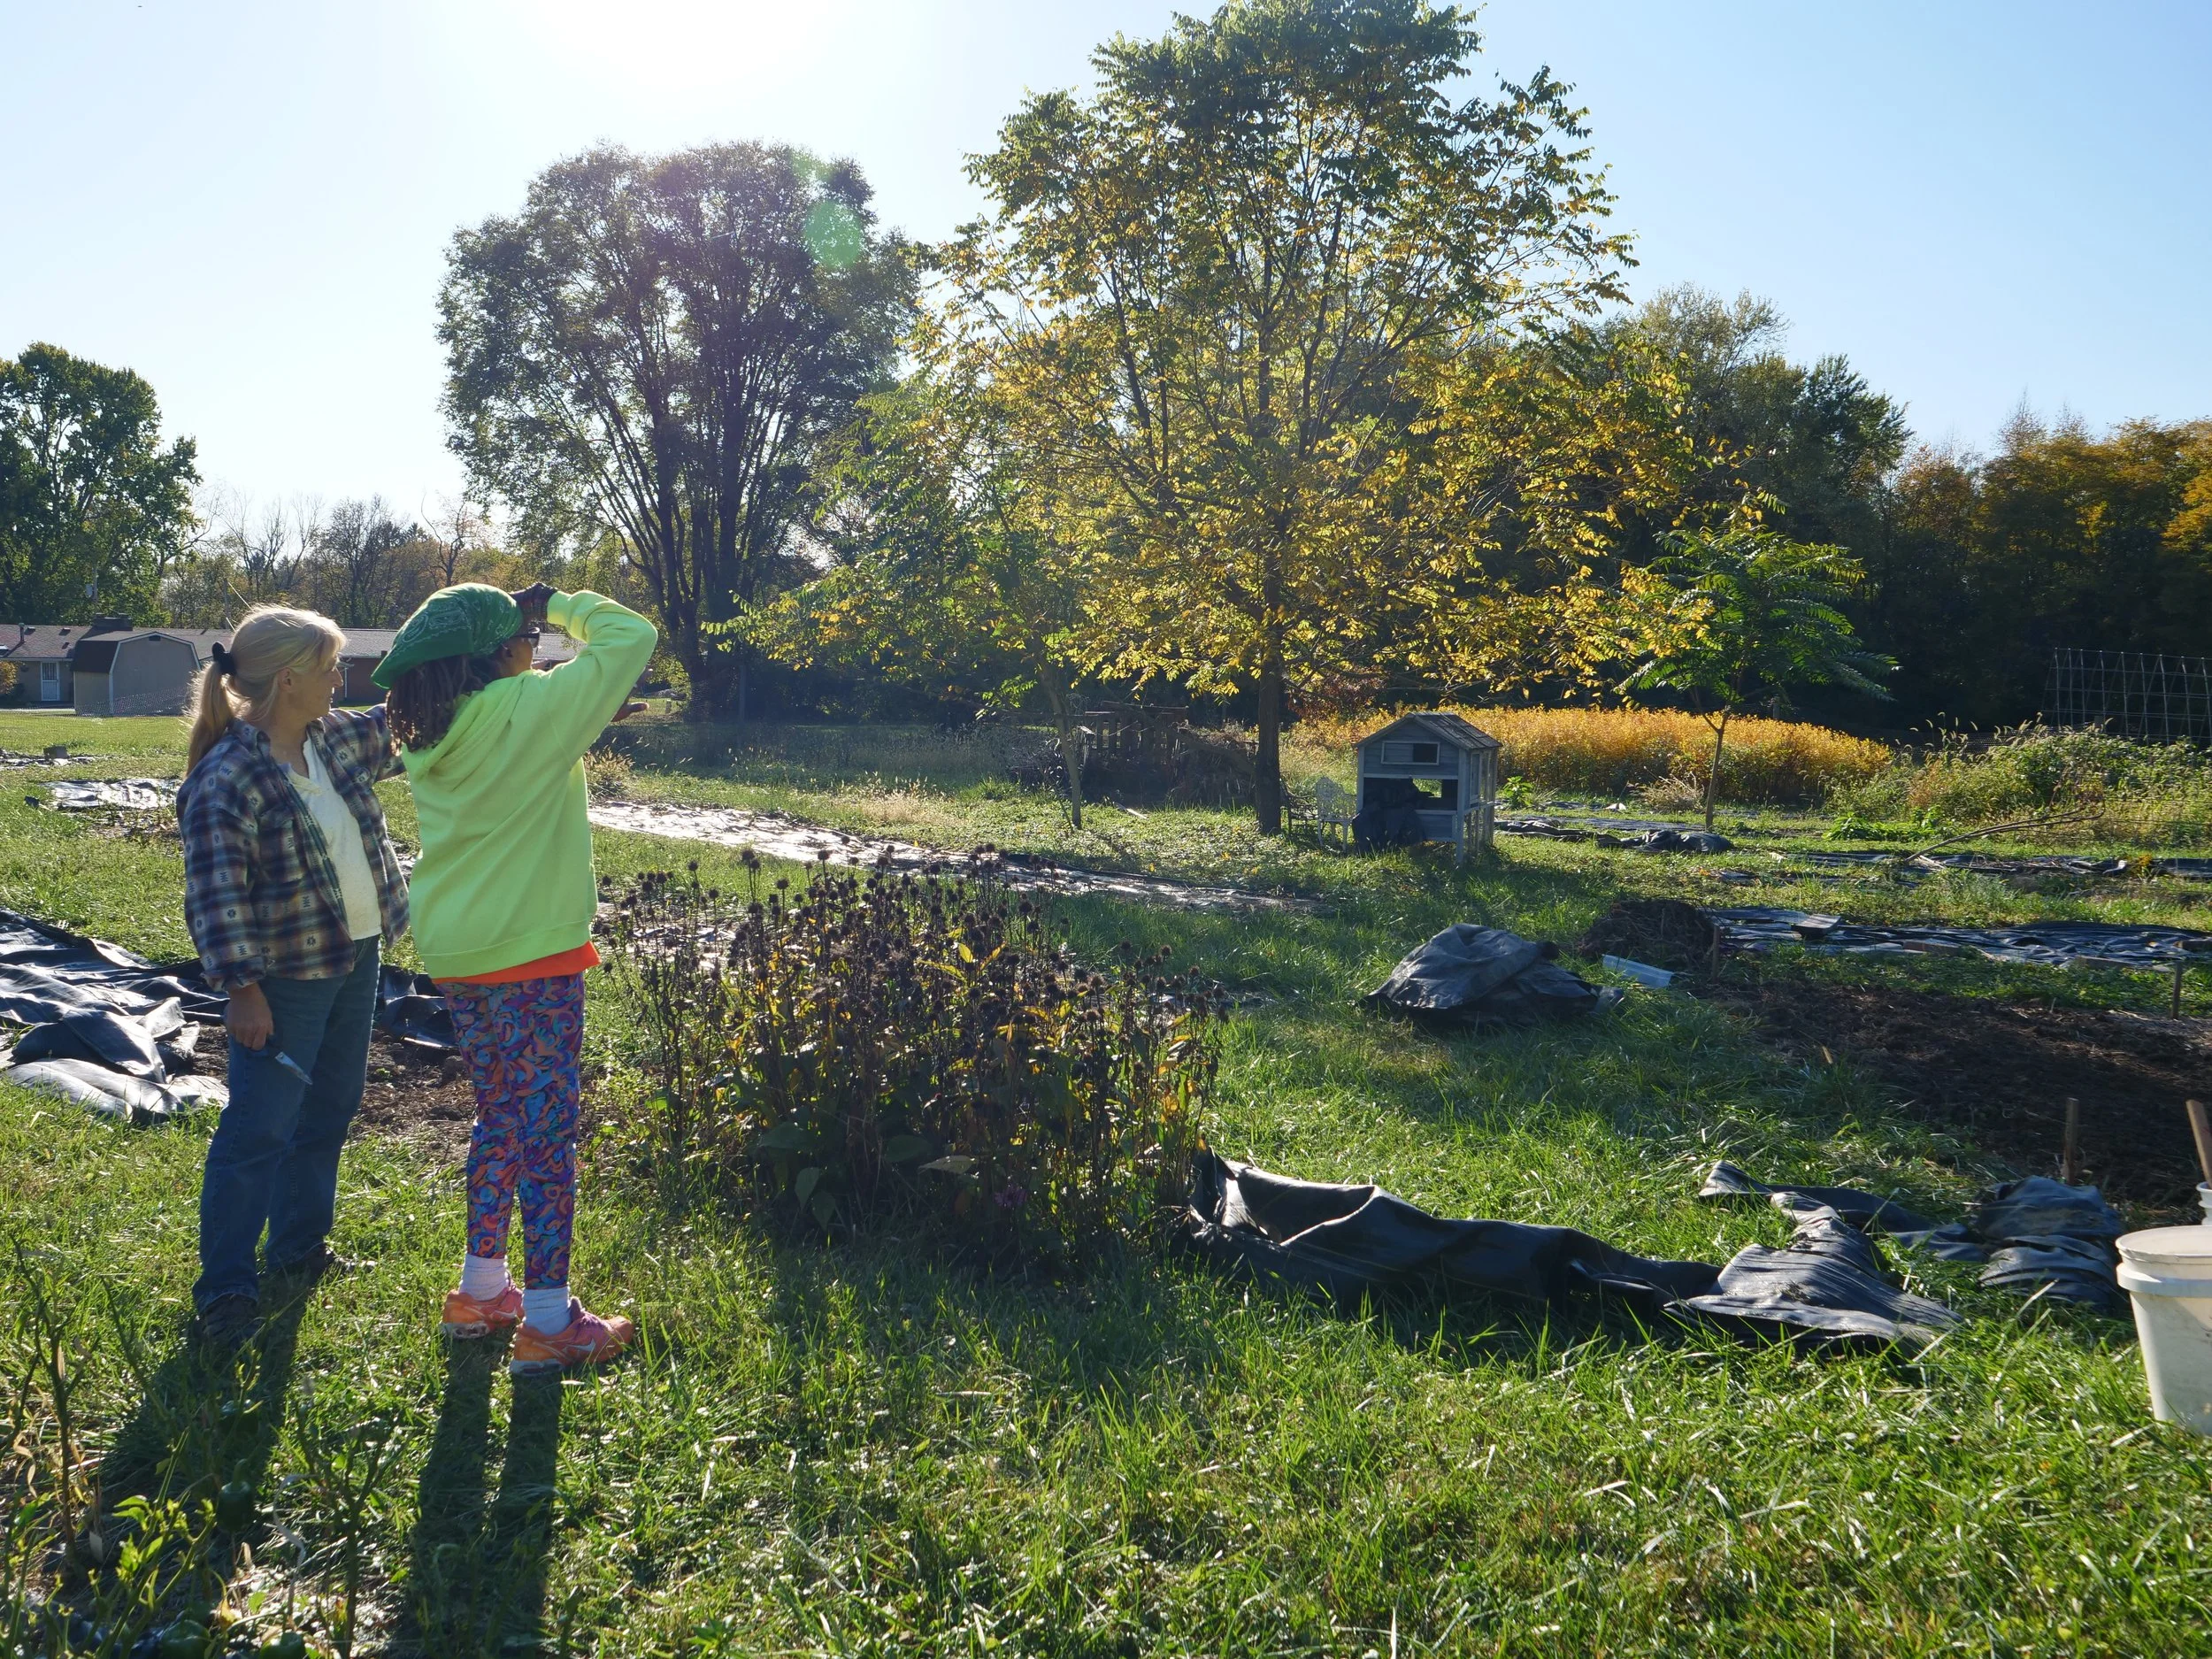
Land without human activity isn’t absence. It’s actually the opposite — luminous presence. This is true even, or especially, on sunless days.

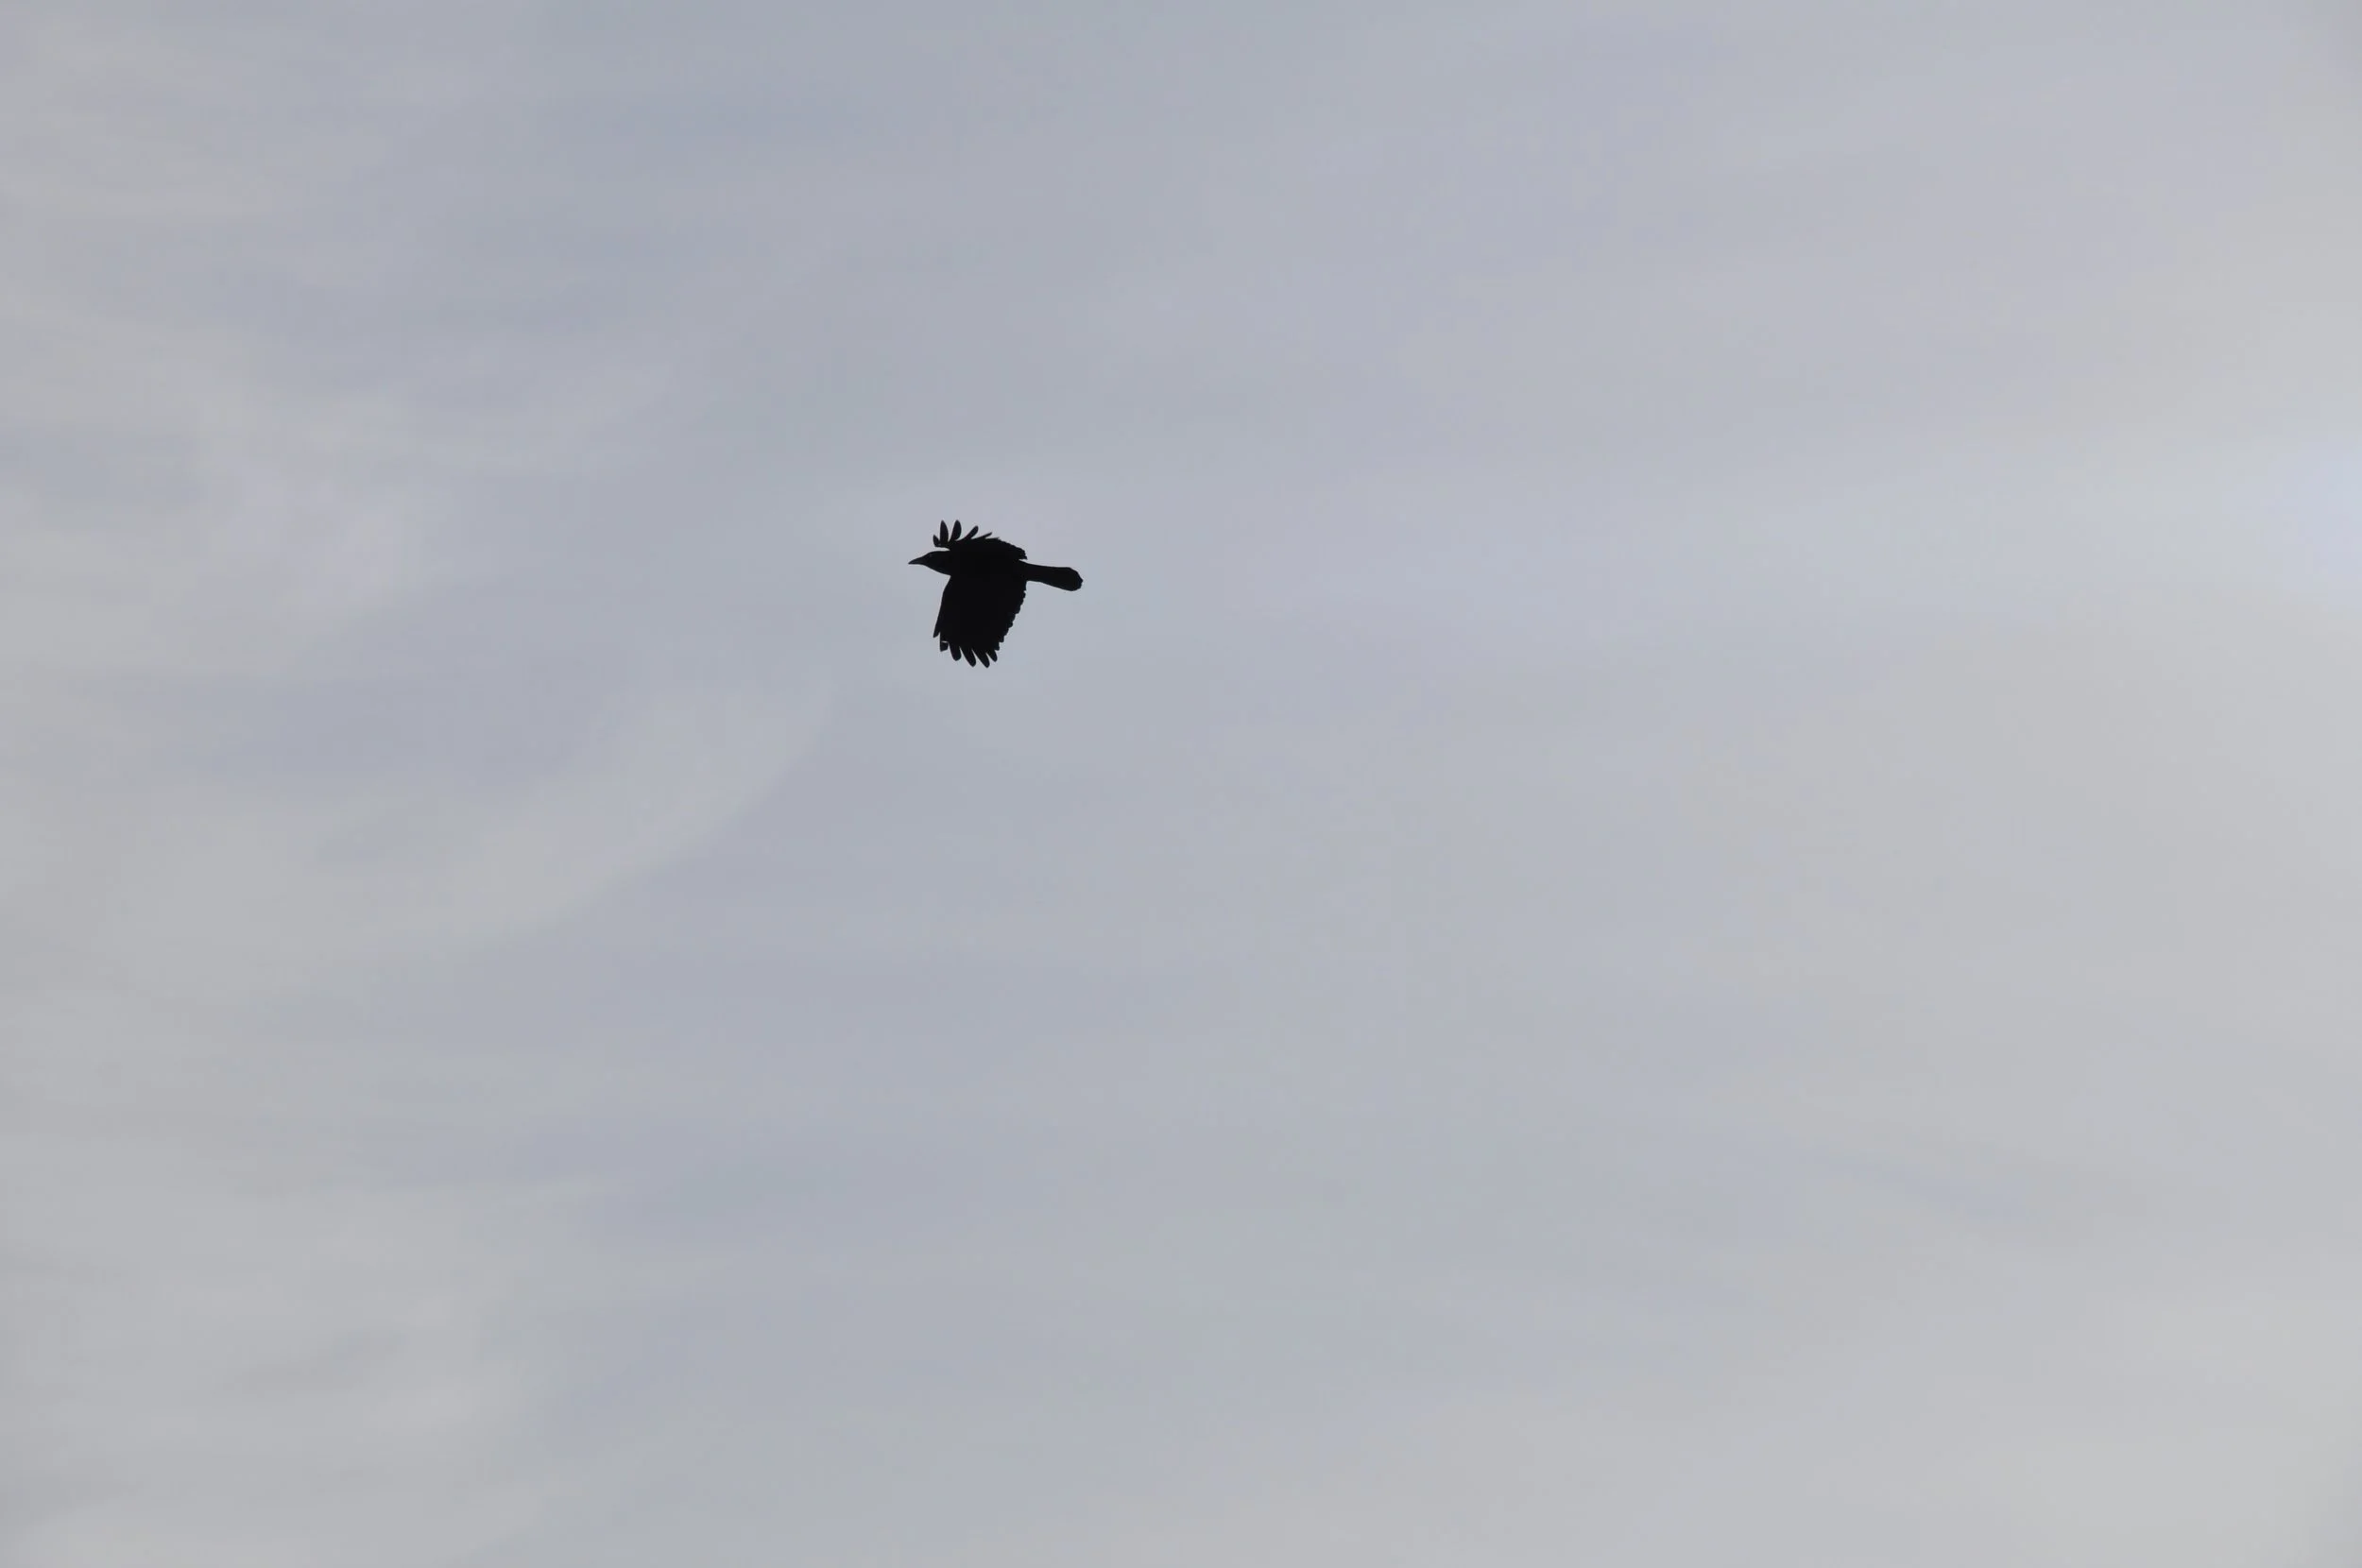
‘Morning Crows’: A Poem by Alberta Dempsey
“i did not think i would miss them,
but today i woke in the cold air
and cawed like they did”

‘Why I’m Doing This Work’: Amanda Hernandez on Learning from Cuban Farmers
Last November, as a professional development opportunity, Amanda Hernandez took part in an international agroecology conference organized by Cuba’s National Association of Small Farmers. She returned to Agraria deeply inspired.
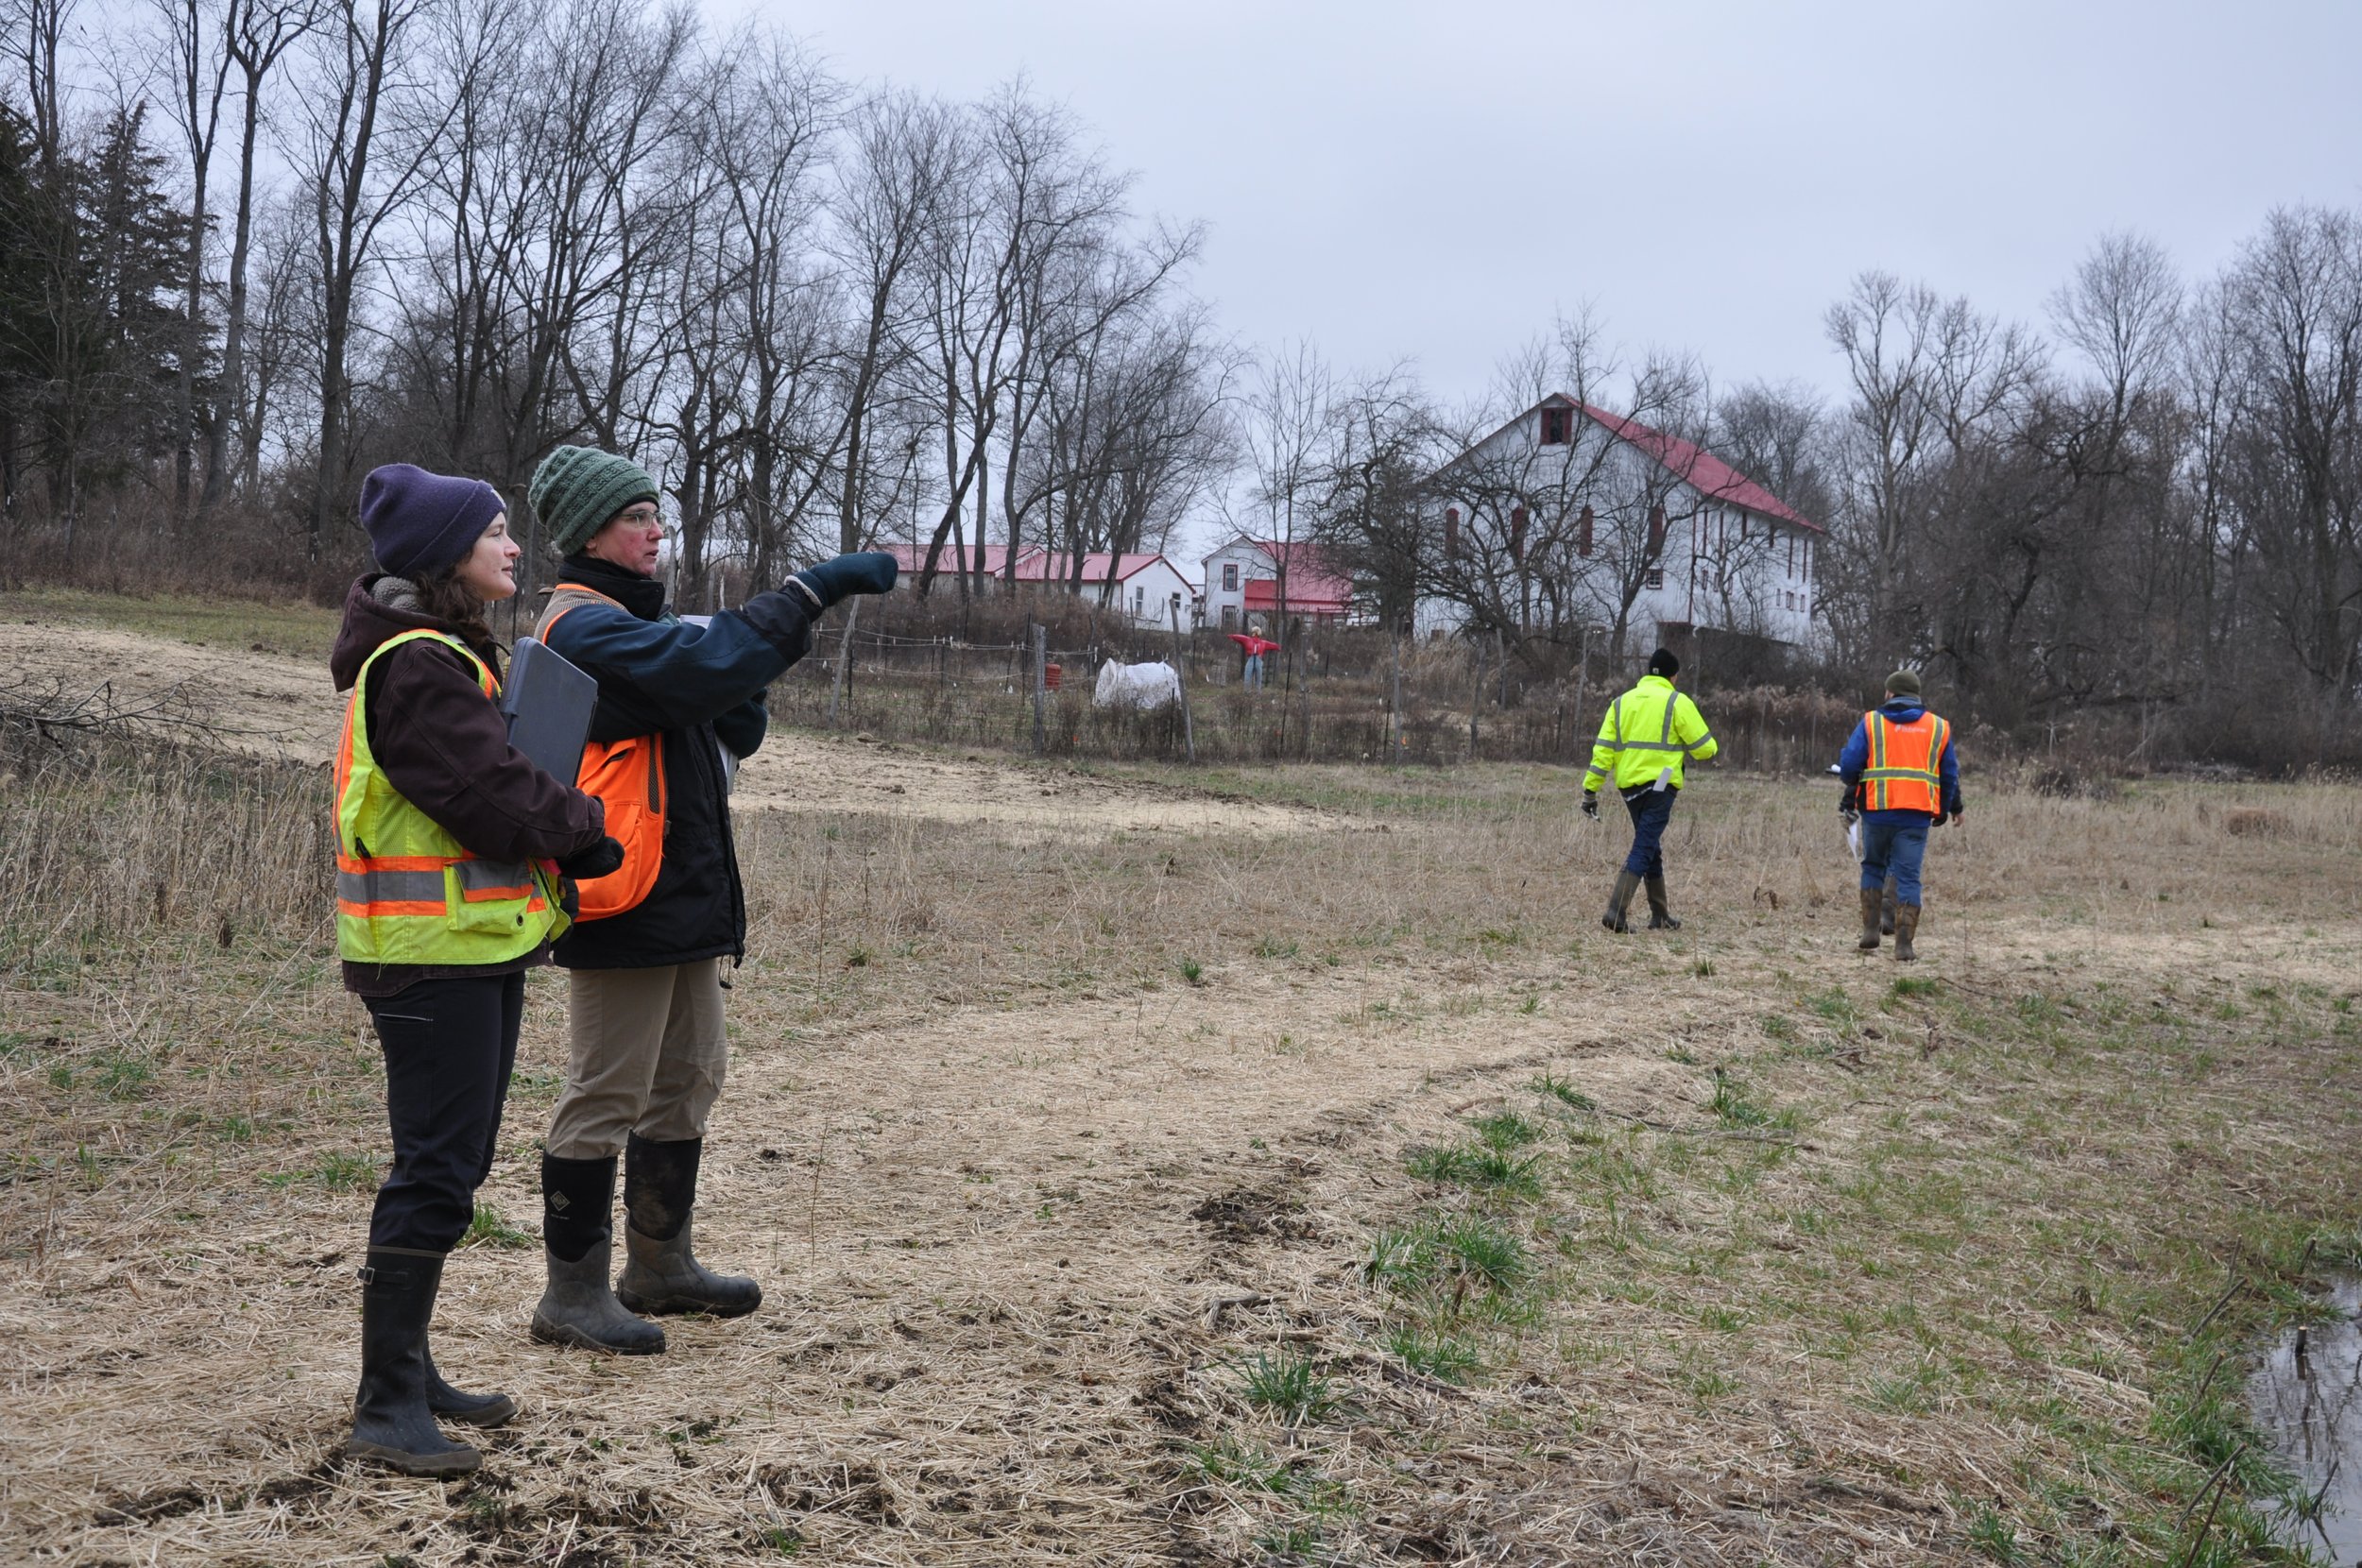
Glimmer of the Future: Construction Completed on Jacoby Branch Restoration
A two-hour site walk on Jan. 6 took participants through the rebuilt stream system that represents the now-completed construction phase of the Jacoby Branch restoration, a 10-year, $2 million project led by The Nature Conservancy, or TNC.

Ready, set…
As Winter tightens its grip and ice crystals cover the ground, we farmers dream of lush fields of green. We’ve analyzed last year’s production, laid out our crop plan, and perhaps, even ordered seed or are sprouting some we saved. This is the season of preparation.


Last Days of the Year: Finding Time
For most of our human lives, time is a matter of milestones and increments. Our clocks and calendars are nets over time, but they can’t catch time, any more than a net can trap water. And yet — something moves forward, doesn’t it? The seasons are cyclical, but our lives are vectored.
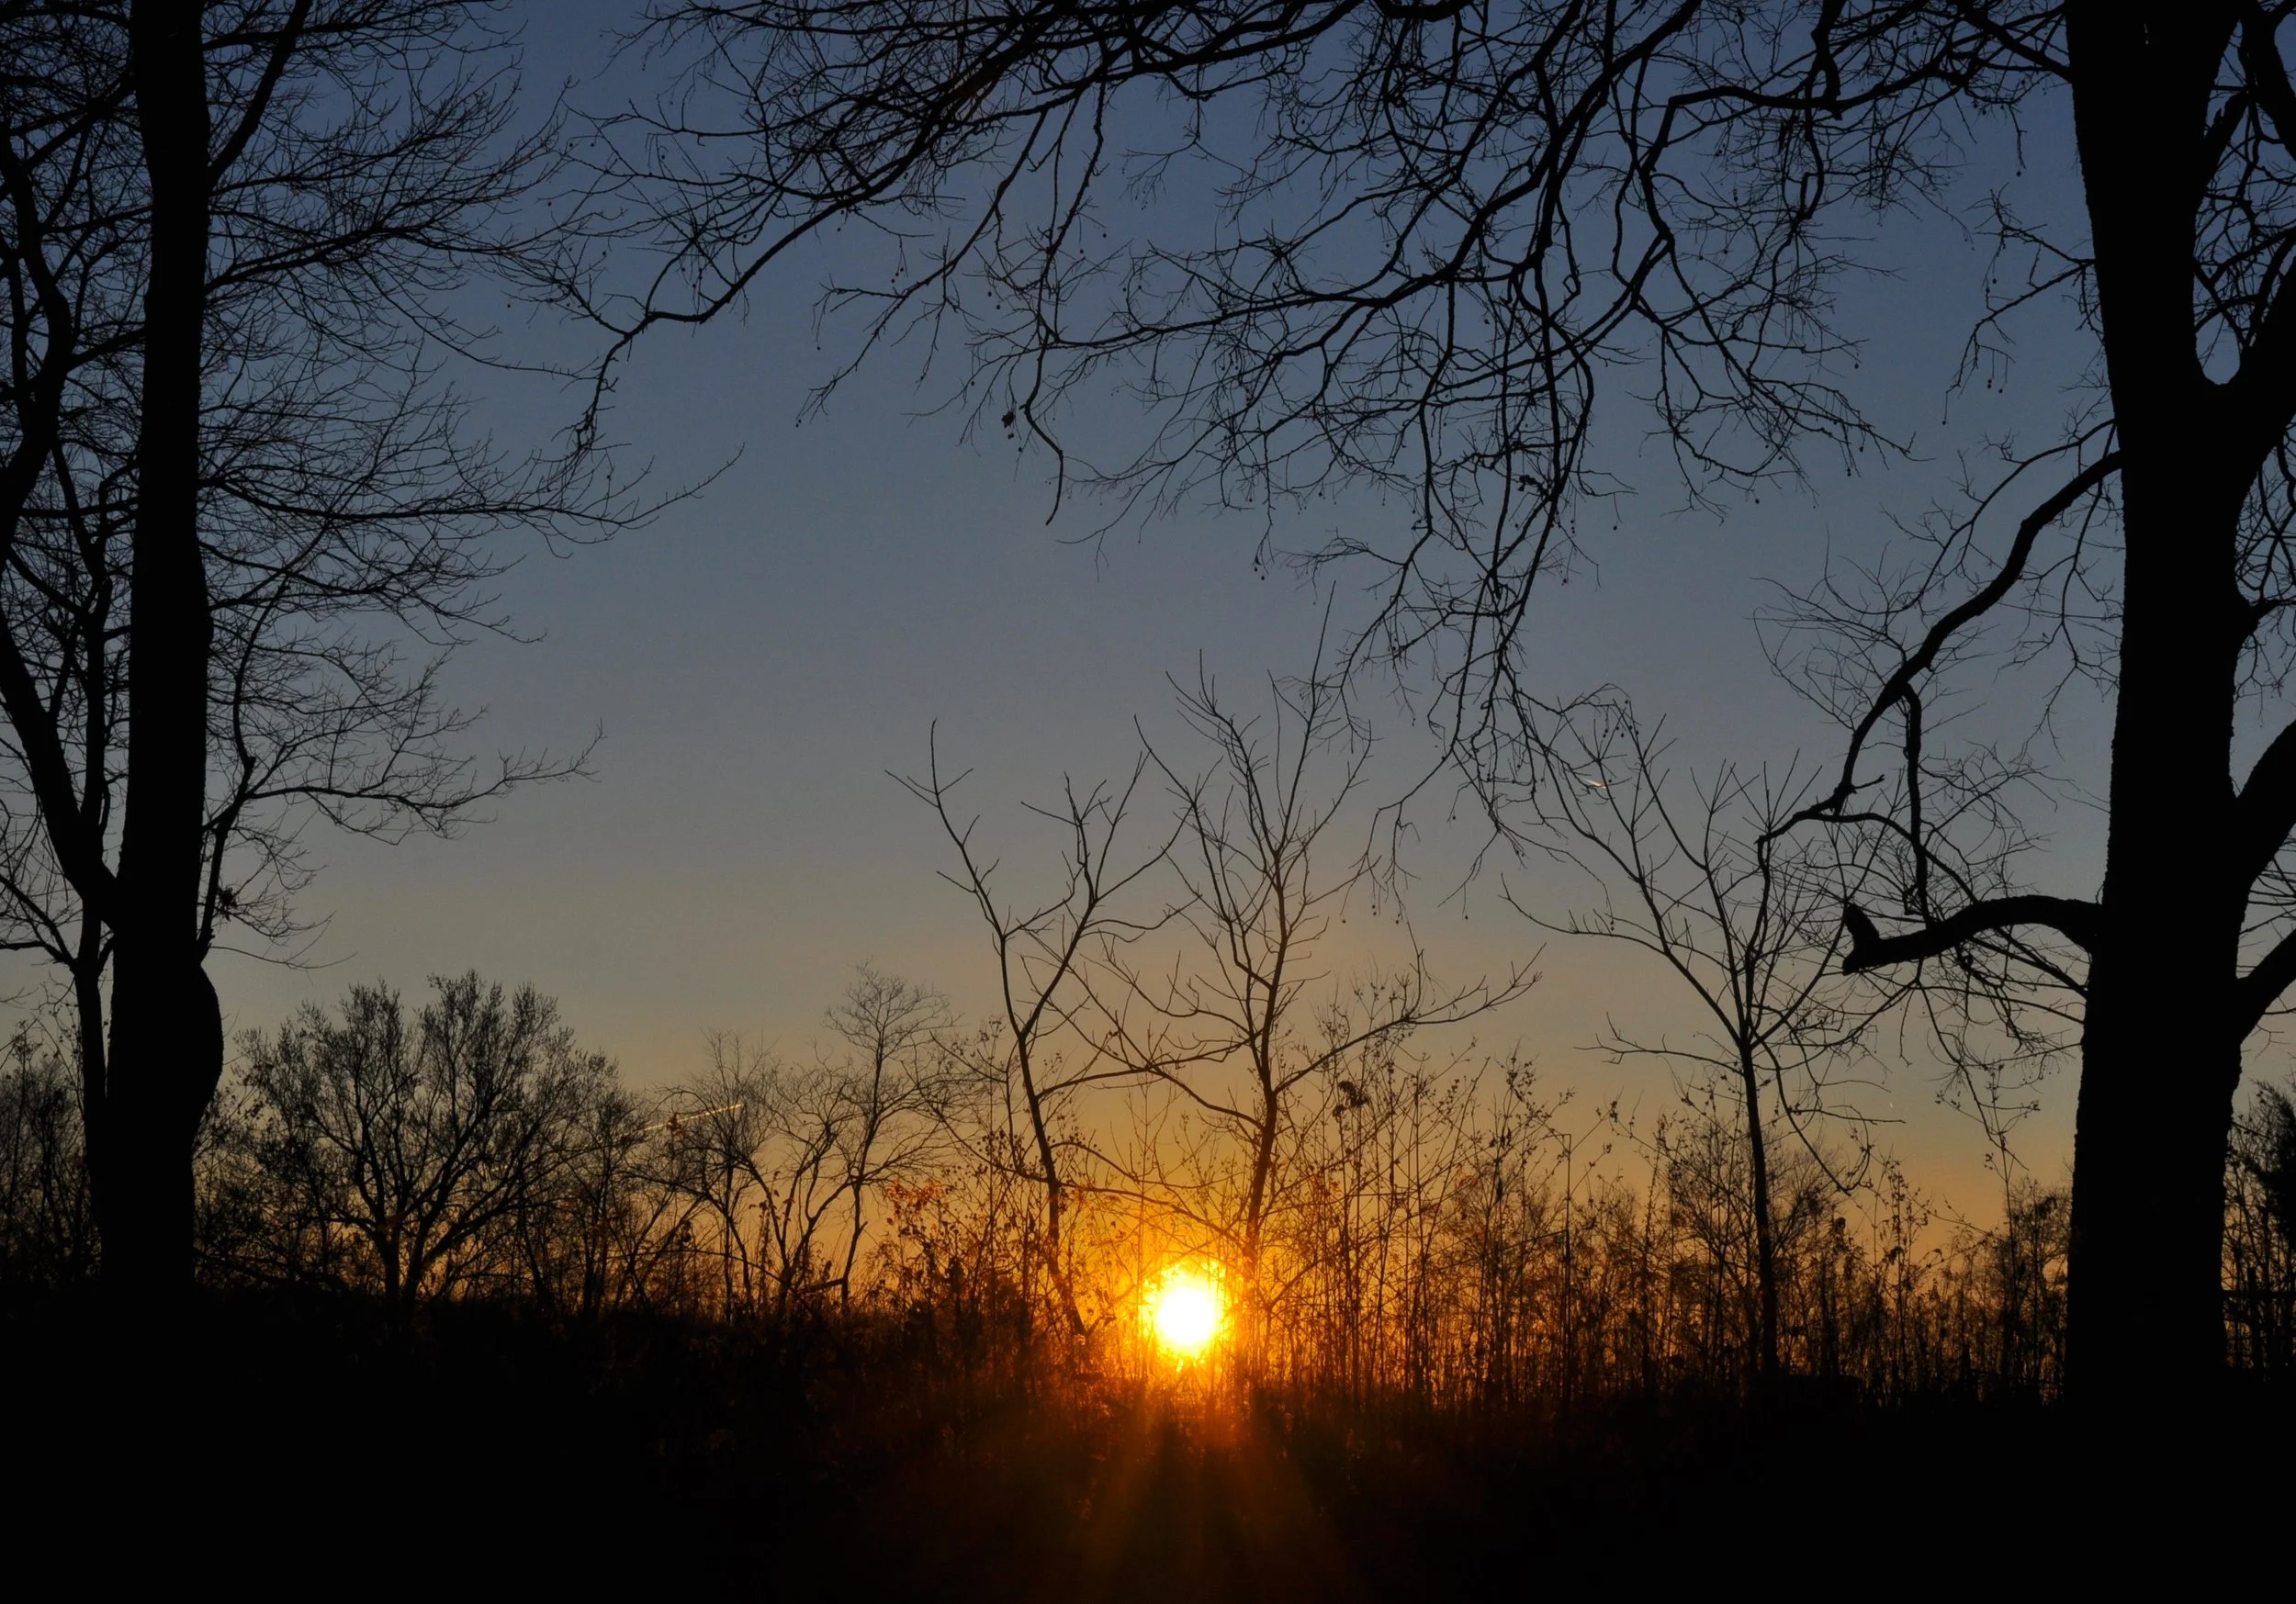
Winter Solstice: Encountering the Darkness
And so it was that last evening, on the Eve before the Winter Solstice, I sought to welcome the darkness to Agraria. May I confess I did so wielding a tool of sight, a dazzlingly powerful camera, which I pointed at the setting sun and the brushstrokes of darkness it set upon the land?

Fungi Friday: The Winter Sun
Another gray day. For me, the winter blues start rolling in early, right after Halloween. When the sun disappears sooner and the comfortable autumnal temperatures drop, I feel more sleepy, sluggish, and sad. Suppose you notice drastic shifts in your mood during certain times of the year, especially during the bleak, dark winter months.
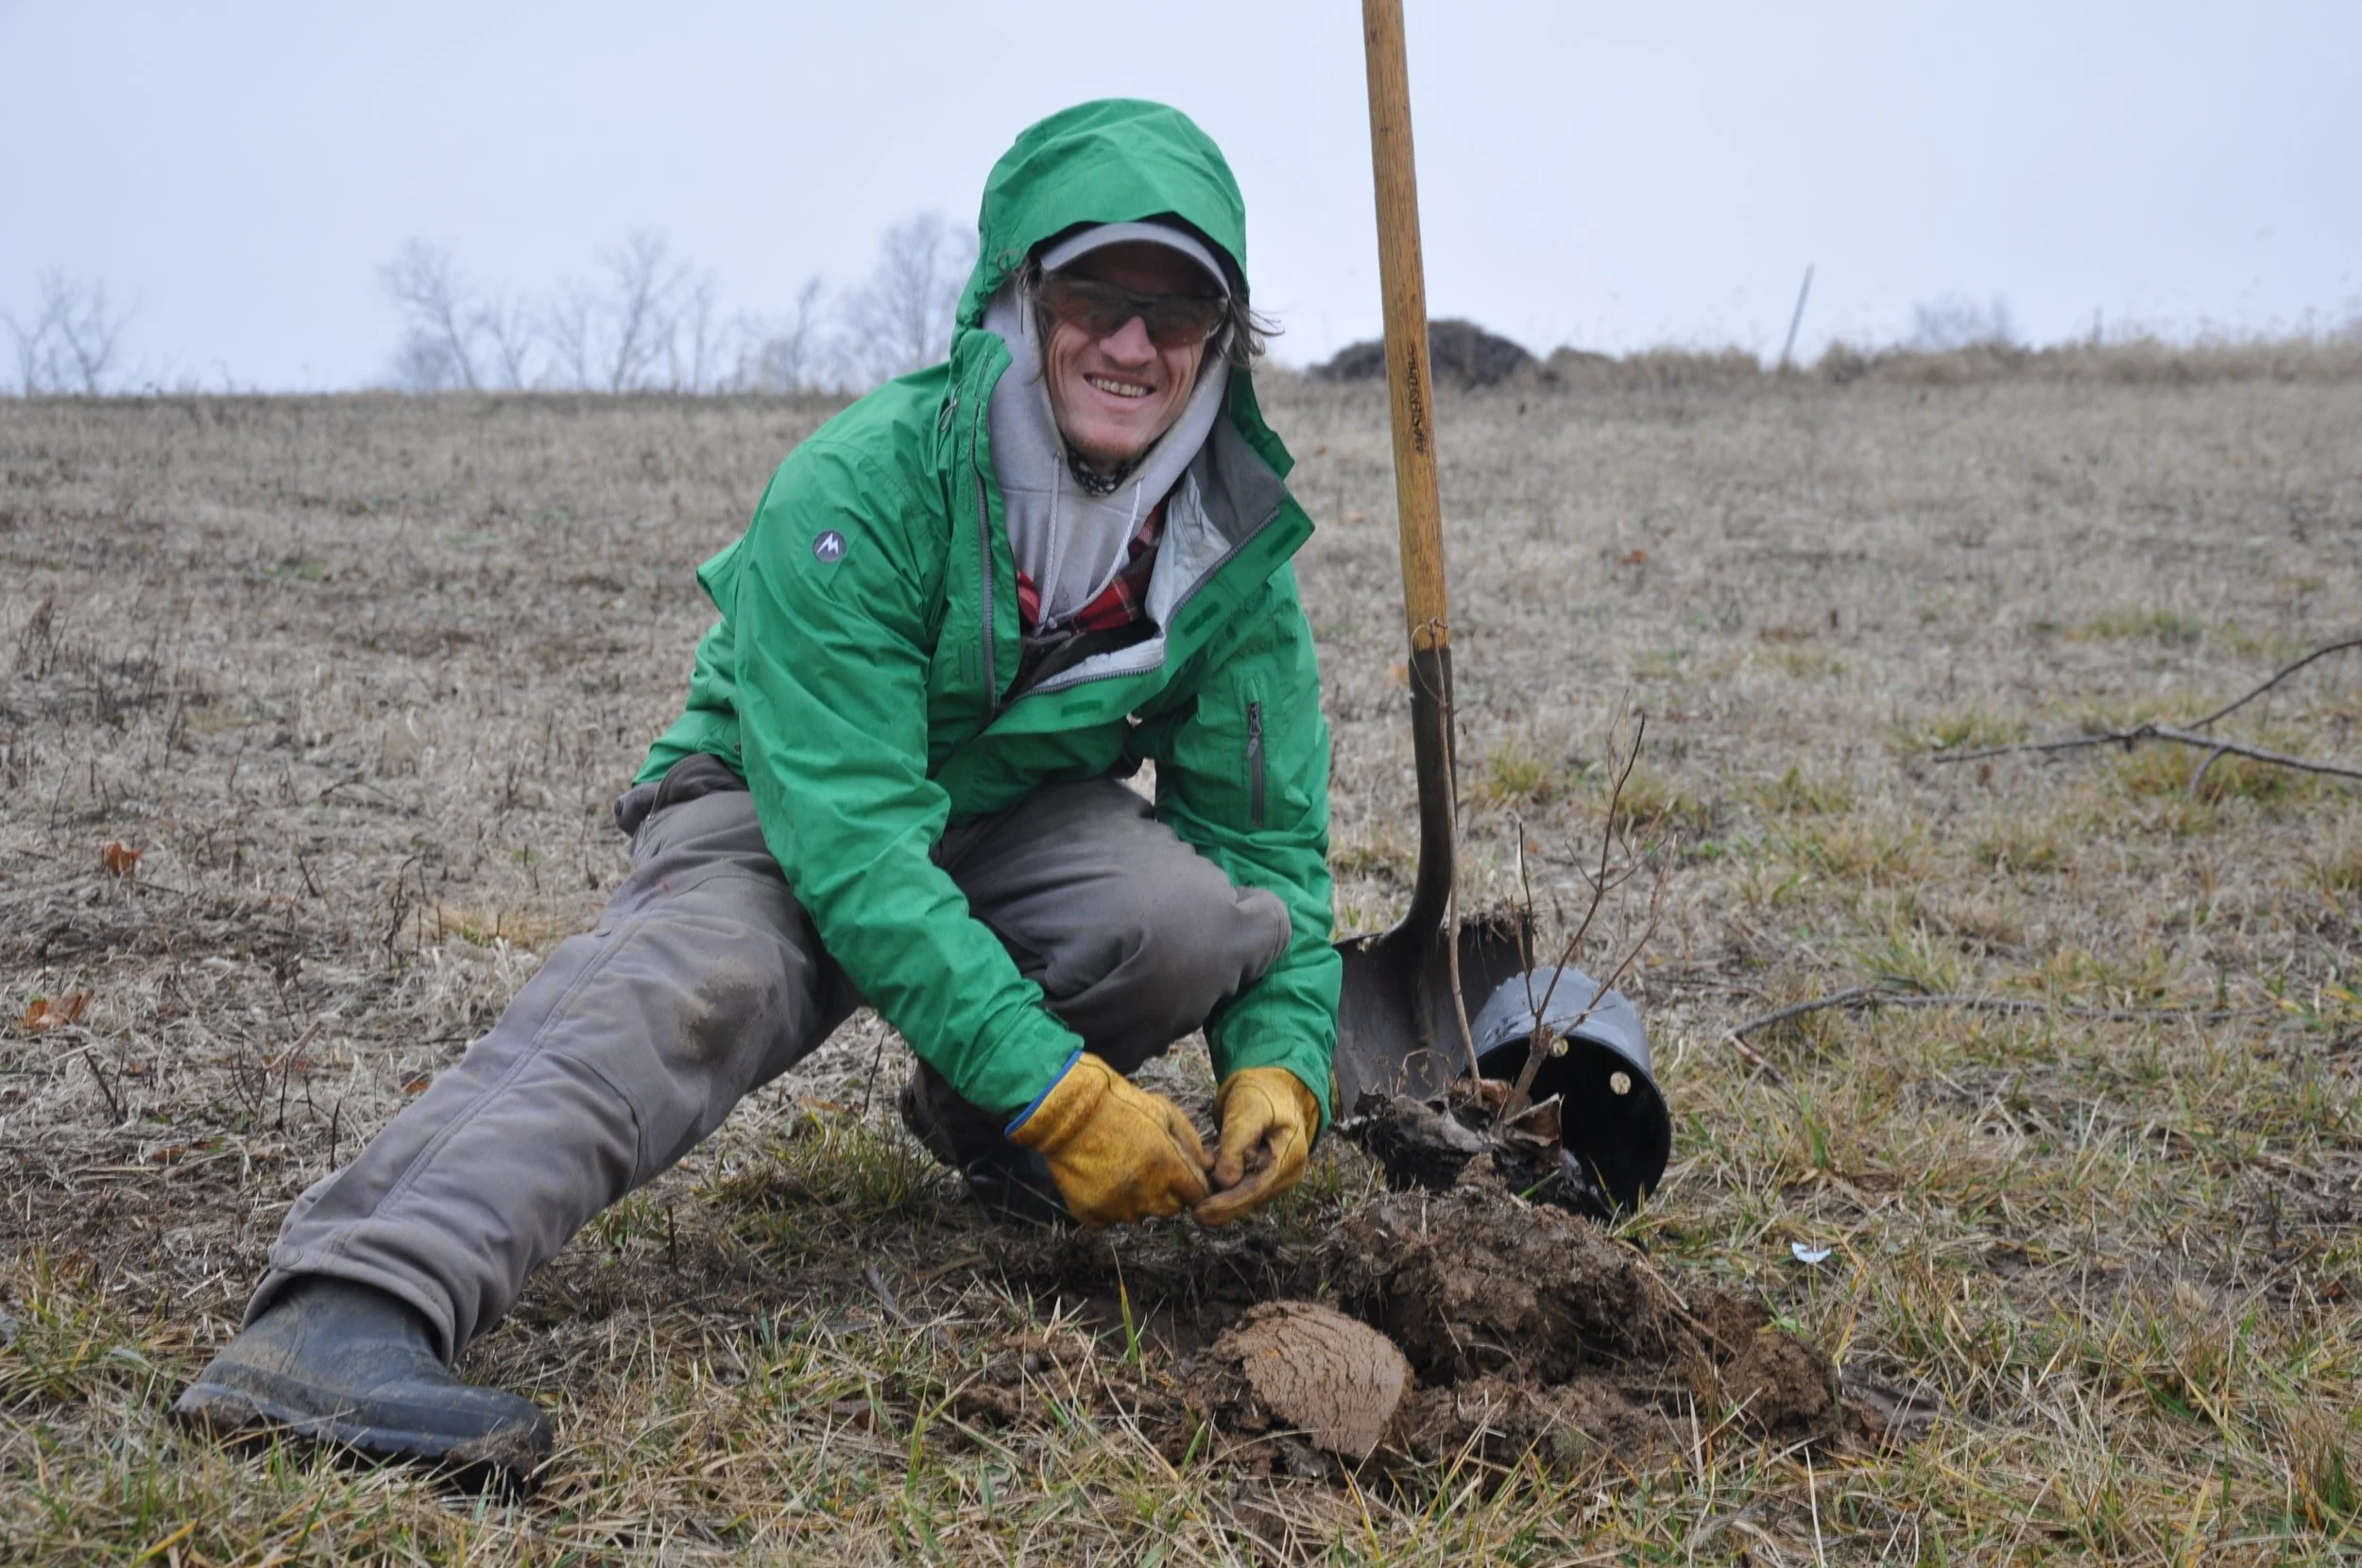
‘The Community of Everything’: Planting Trees on the George Washington Carver Farm
Land Team members David Brown and Matthew Salazar slipped new trees and woody plants into the ground this week. Three elderberry bushes, three tulip poplars, and one destined-for-mightiness sycamore now grace the riparian area of Agraria’s George Washington Carver Farm, the first of a series of planned native plantings at the site.

#GivingTuesday, and Giving Hope
The results are in! Nonprofits worldwide raised $3.1 billion on #GivingTuesday this year. Here in Yellow Springs, Agraria took part in the global day of giving, bringing in a bountiful $6,493 in donations toward the growth and development of the George Washington Carver Farm.
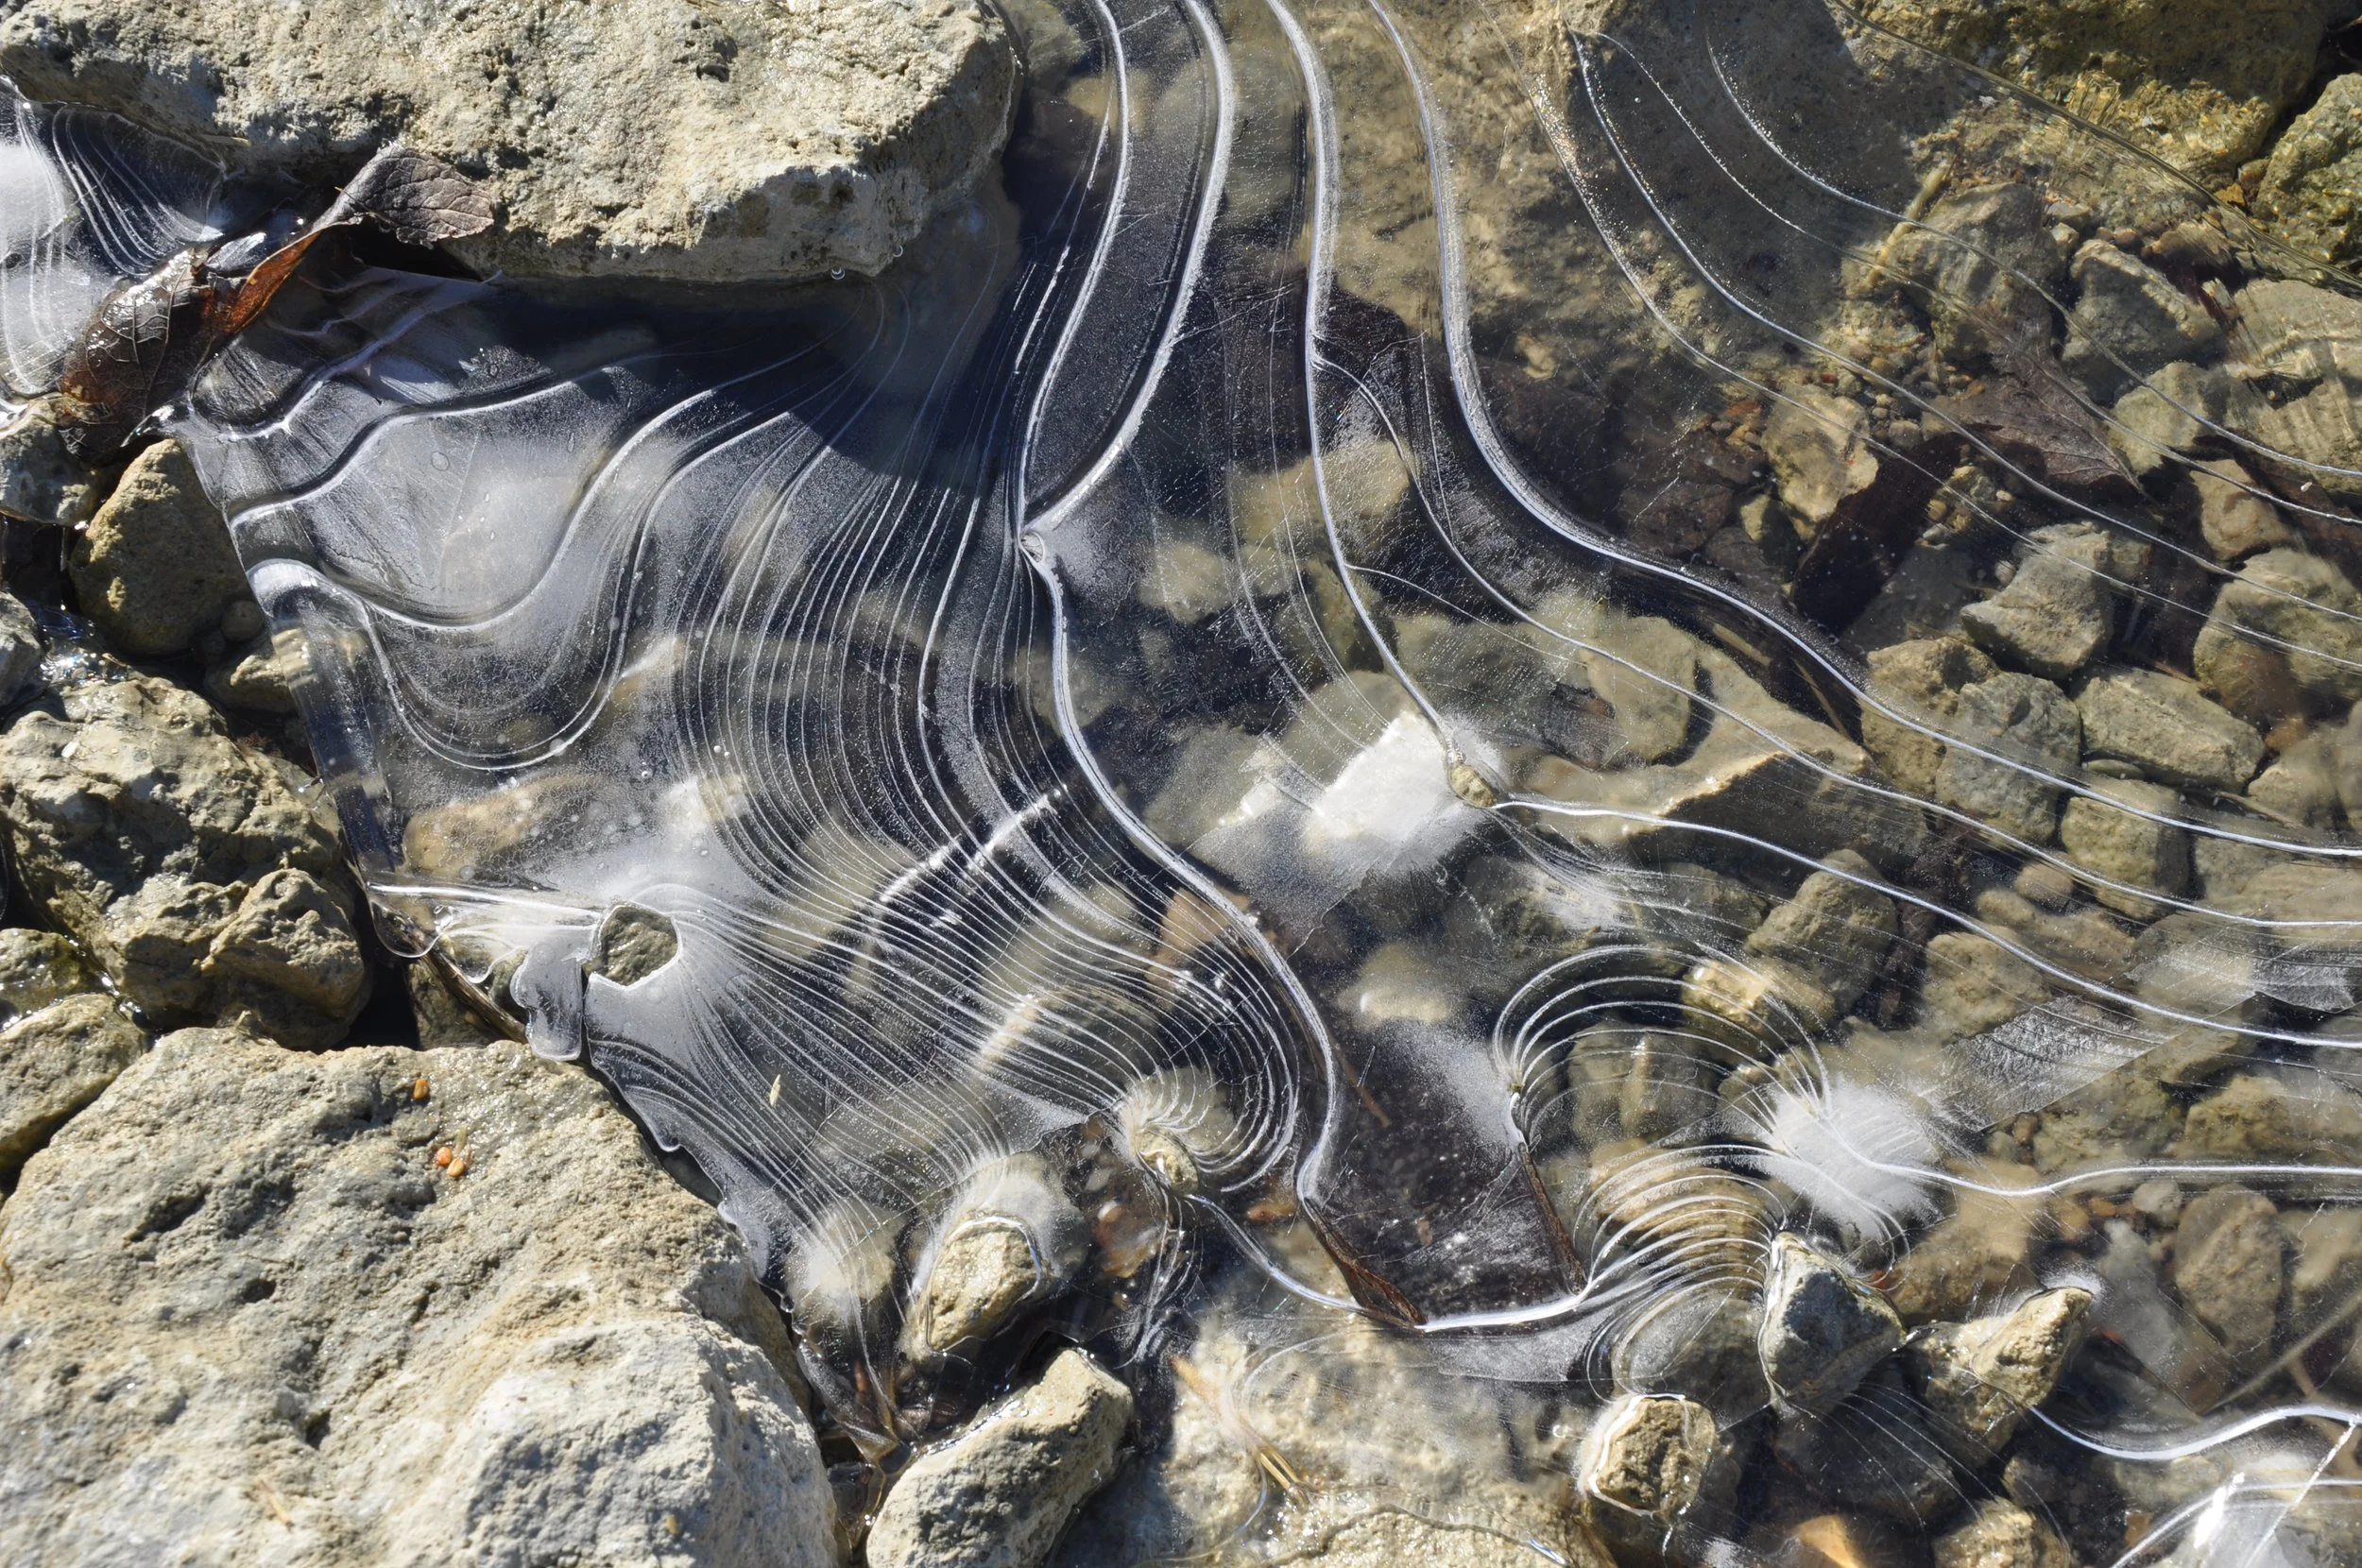
In Search of Details
I went in search of a few details on Thursday morning. Temperatures had dipped to 20 the night before, inviting ice to form along the margins of a pool in re-meandered Jacoby Creek. A lace of ice, a contour of clear ribbon candy. “I effuse my flesh in eddies, and drift it in lacy jags,” Walt Whitman wrote. That’s just what the water had done overnight. Effused into swooping crystalline rainbows, every band the inscrutable color of ice.
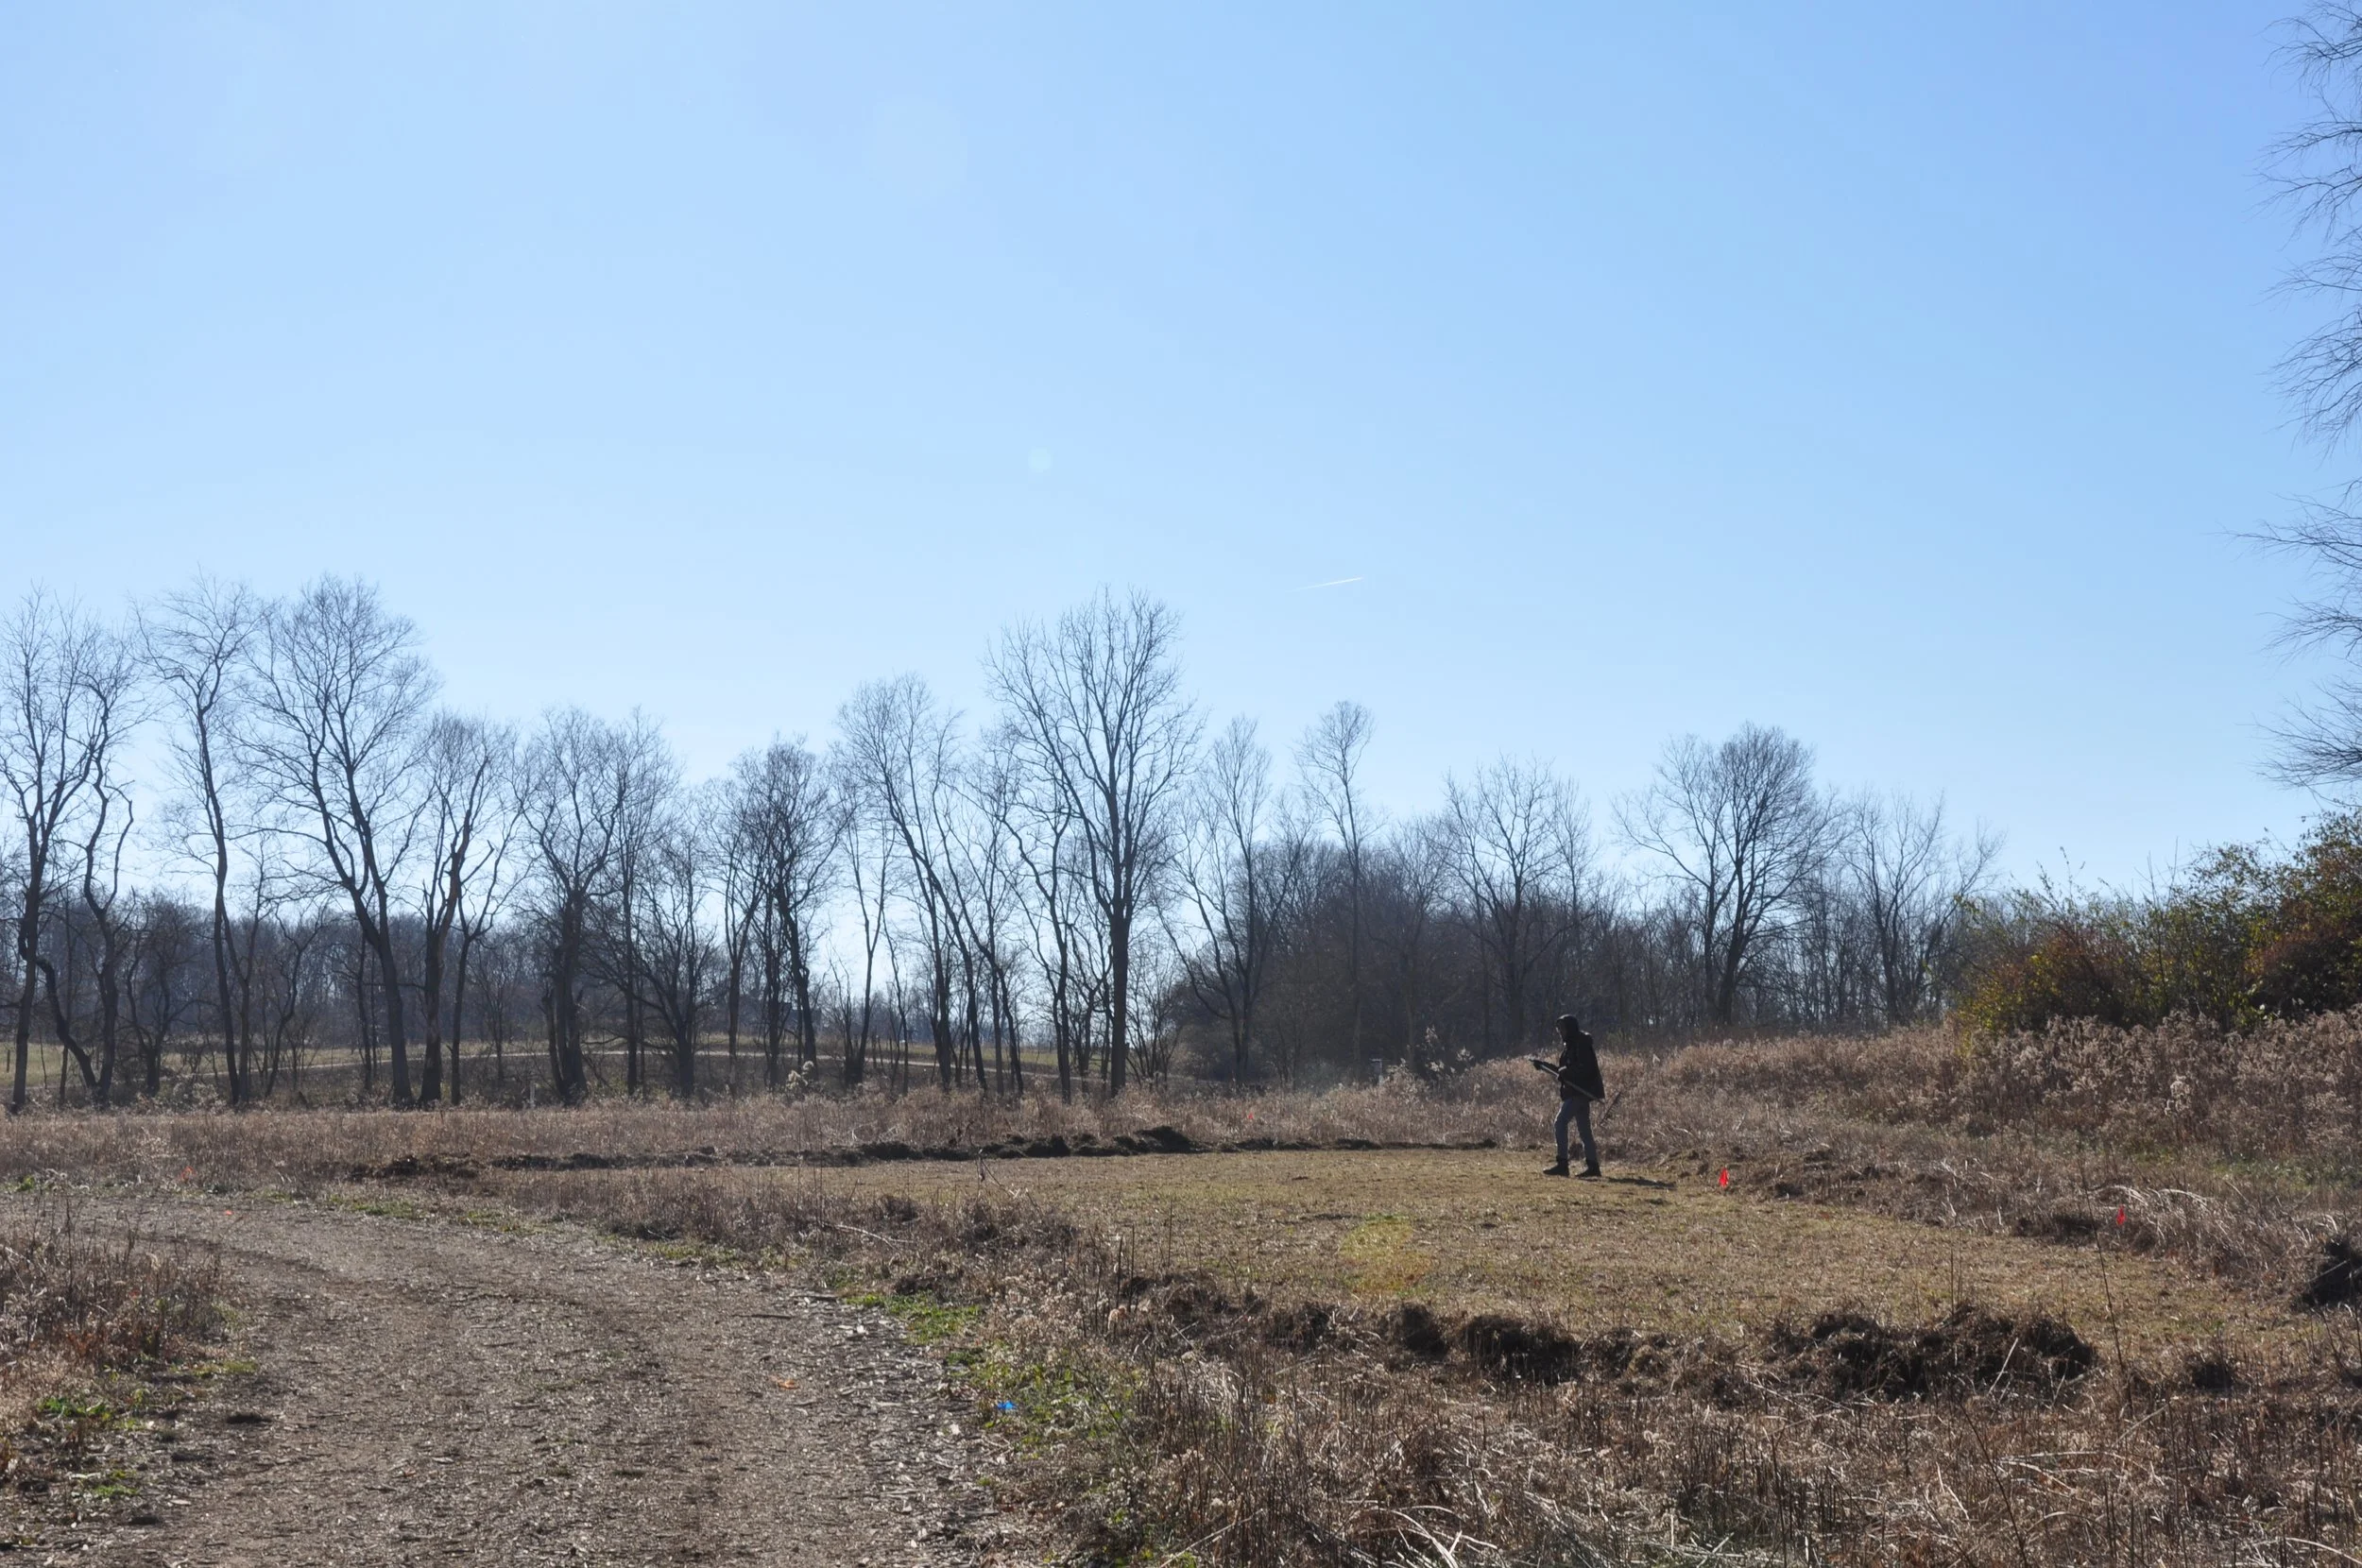
Pollinator Way, Part I: Preparing the Ground
Pollinator Way is taking shape on Agraria. Four “pockets” of concentrated wildflowers and grasses are being created in the open fields between Front Field and South Pasture. The project is supported by an Environmental Quality Incentives, or EQIP, grant that helps farmers and landowners integrate conservation into working lands.

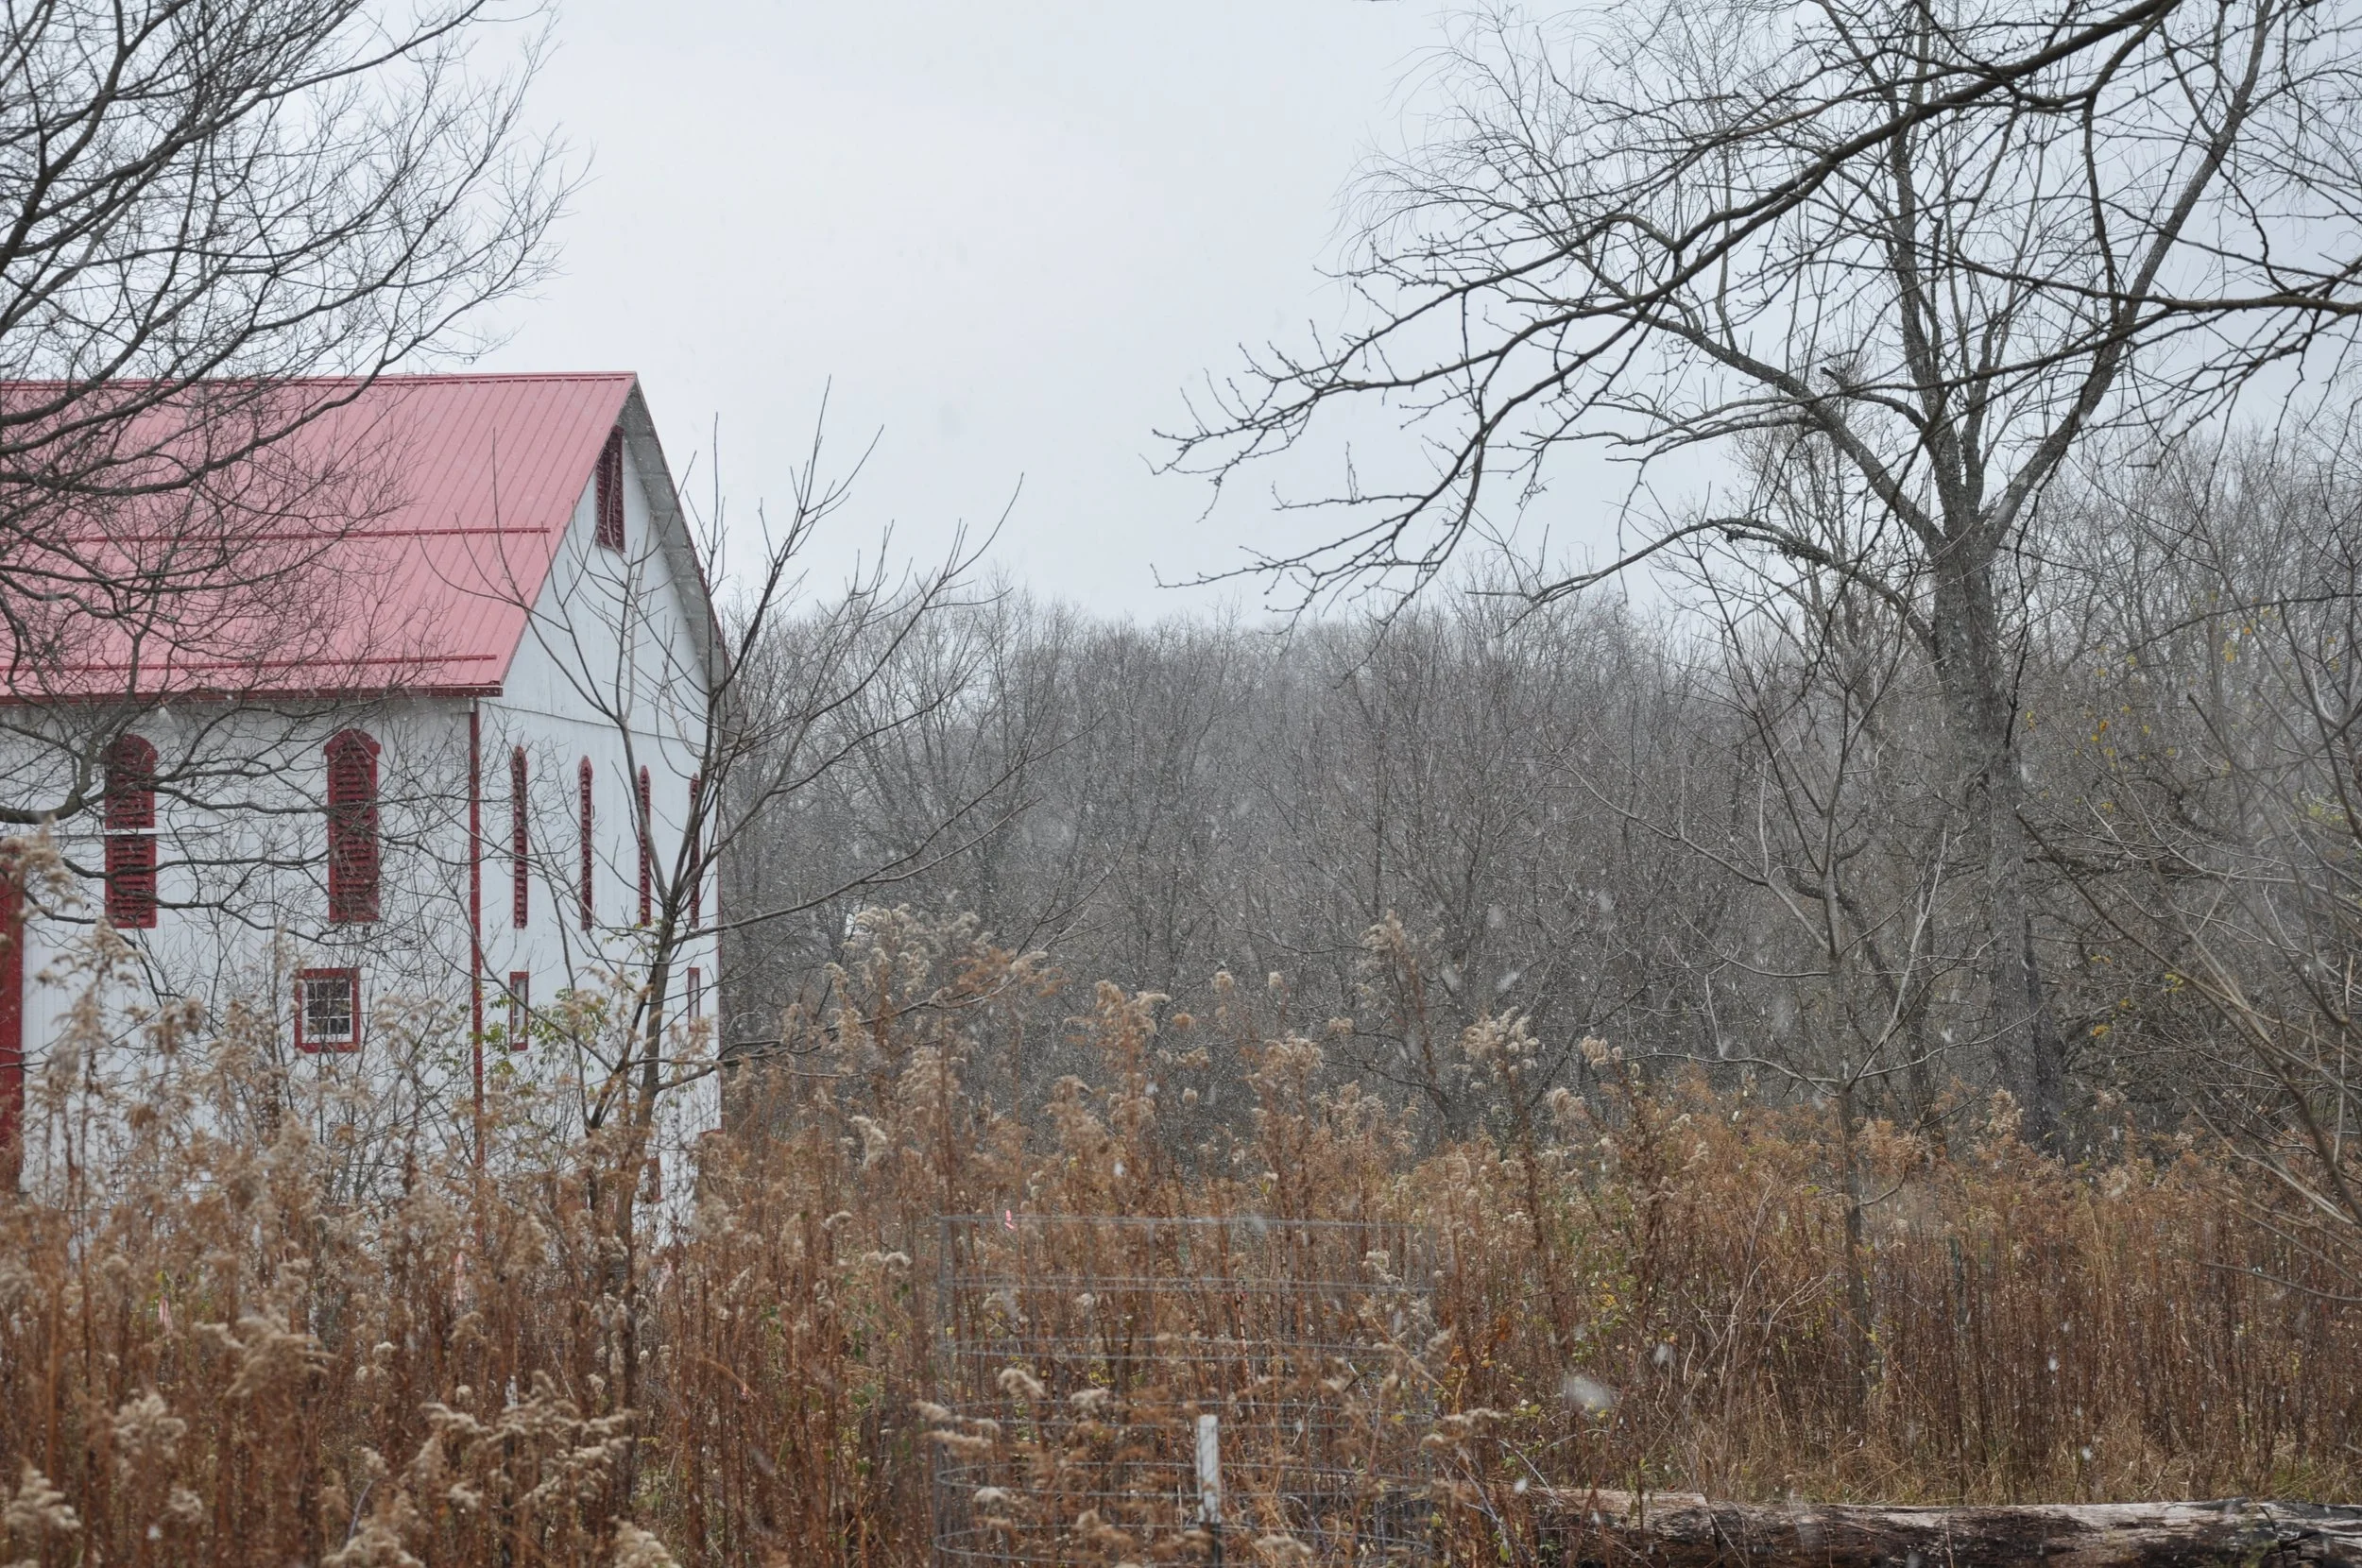
A Rhythmic Stillness
I was outside in it, wandering the land, like those early flakes. Experiencing the shift in weather. When does the thought of snow become the reality of snow? The snow of snow? It’s a hard moment to catch. Before I knew it, the few flakes were the many. I was outside — and inside the palace of weather, the house of snow.

Winter’s Blanket
As Winter approached, my Grandpa Ellis always checked his almanac for precipitation forecasts. He said that snow was “winter rain”, refilling underground aquifers and storing water in the soil to ensure bountiful summers. School never closed because of snow; we walked in the morning, went home for lunch and then back. Despite the discomfort of being layered with woolen pants called “leggings” under our dresses and doubled mittens, we did our best to not complain. Grandpa taught that adversity builds character and that snow was essential for the planet’s rejuvenation. Without it, our agricultural county could face drought and crops would be stunted or fail altogether, resulting in scarcity and high prices.
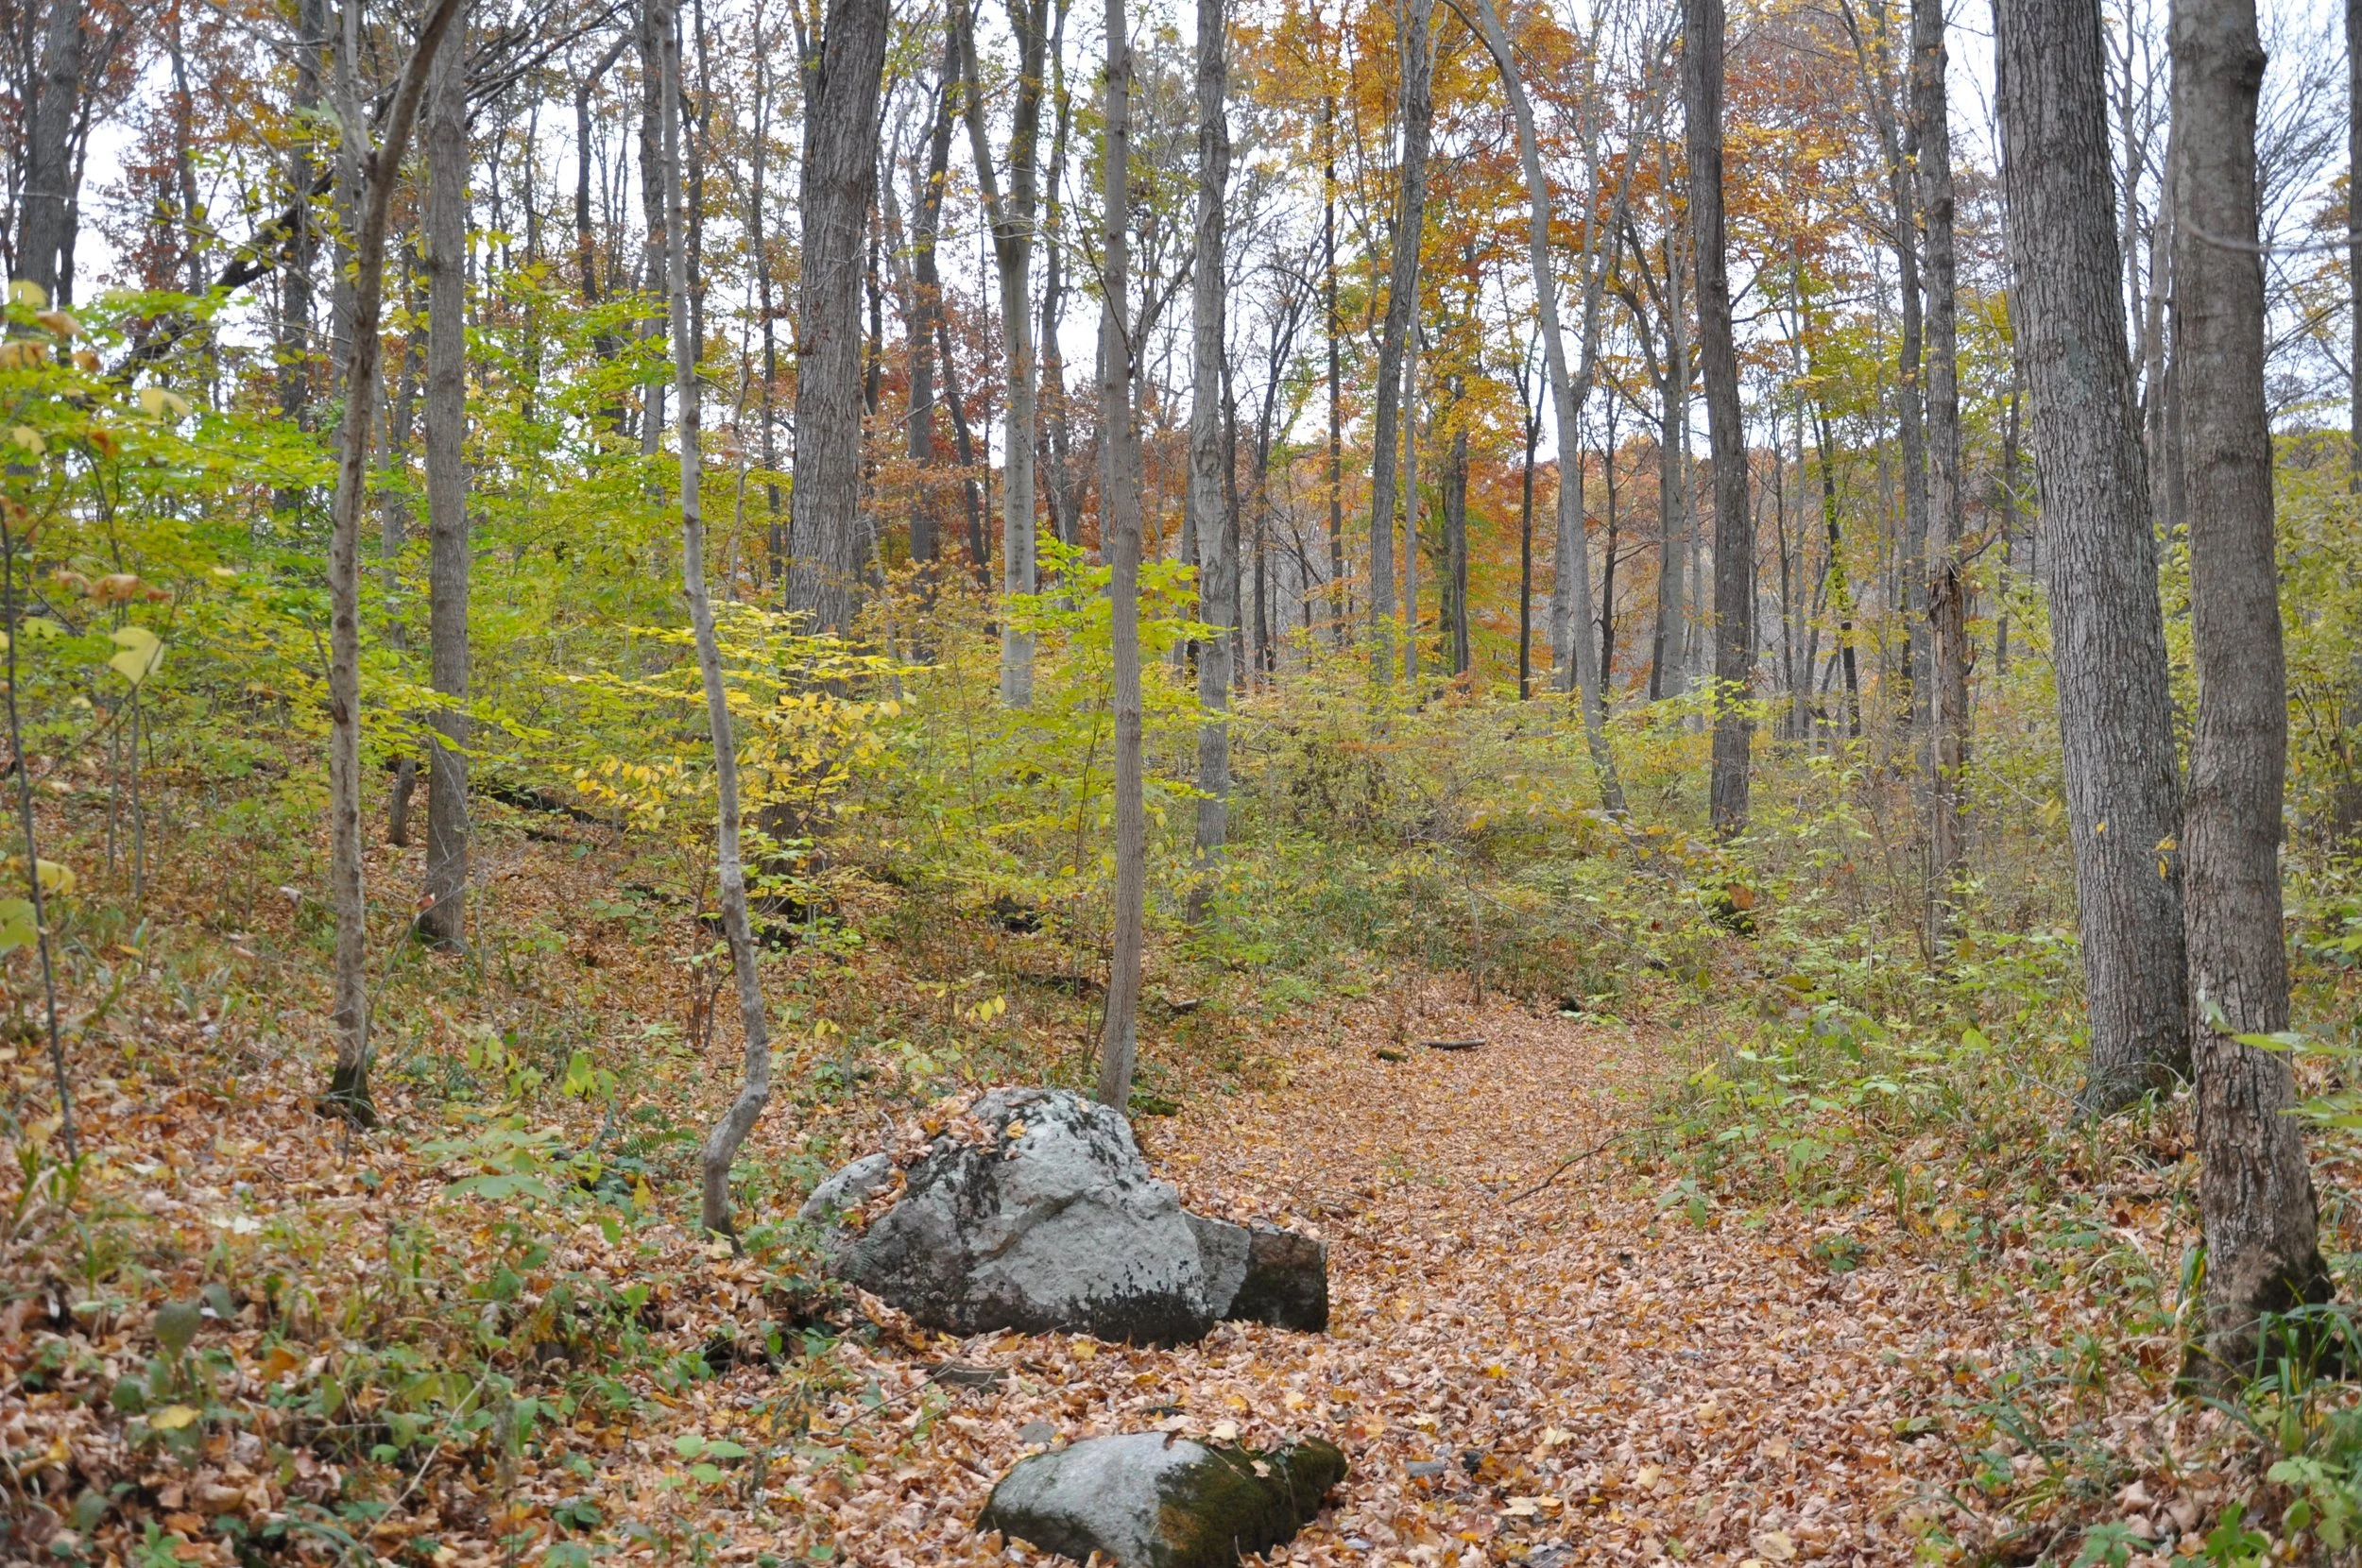
Inside Time: Reflections from the Forest
Any desire to place ourselves on different footing with Great Nature must begin with sensing and knowing where it is our feet already stand. Here. Gravity pulls our feet to the Earth. We lift up, and are pulled back again.

Seed Saving: A Living Legacy that Keeps on Growing
When we save seed, we are saving the important germplasm, or genetic material, within that seed. But it is also critical, to save the story of that seed. Who are those working at the forefront of seed sovereignty today? What are their stories?
Ira Wallace is interested in the seed stories of the African diaspora. A co-owner of Southern Exposure Seed Exchange, she was a featured speaker in Agraria’s second Black Farming conference, and was also interviewed by Amanda Siegel, a student in my Seed Sovereignty and Citizen Action class at Antioch College.
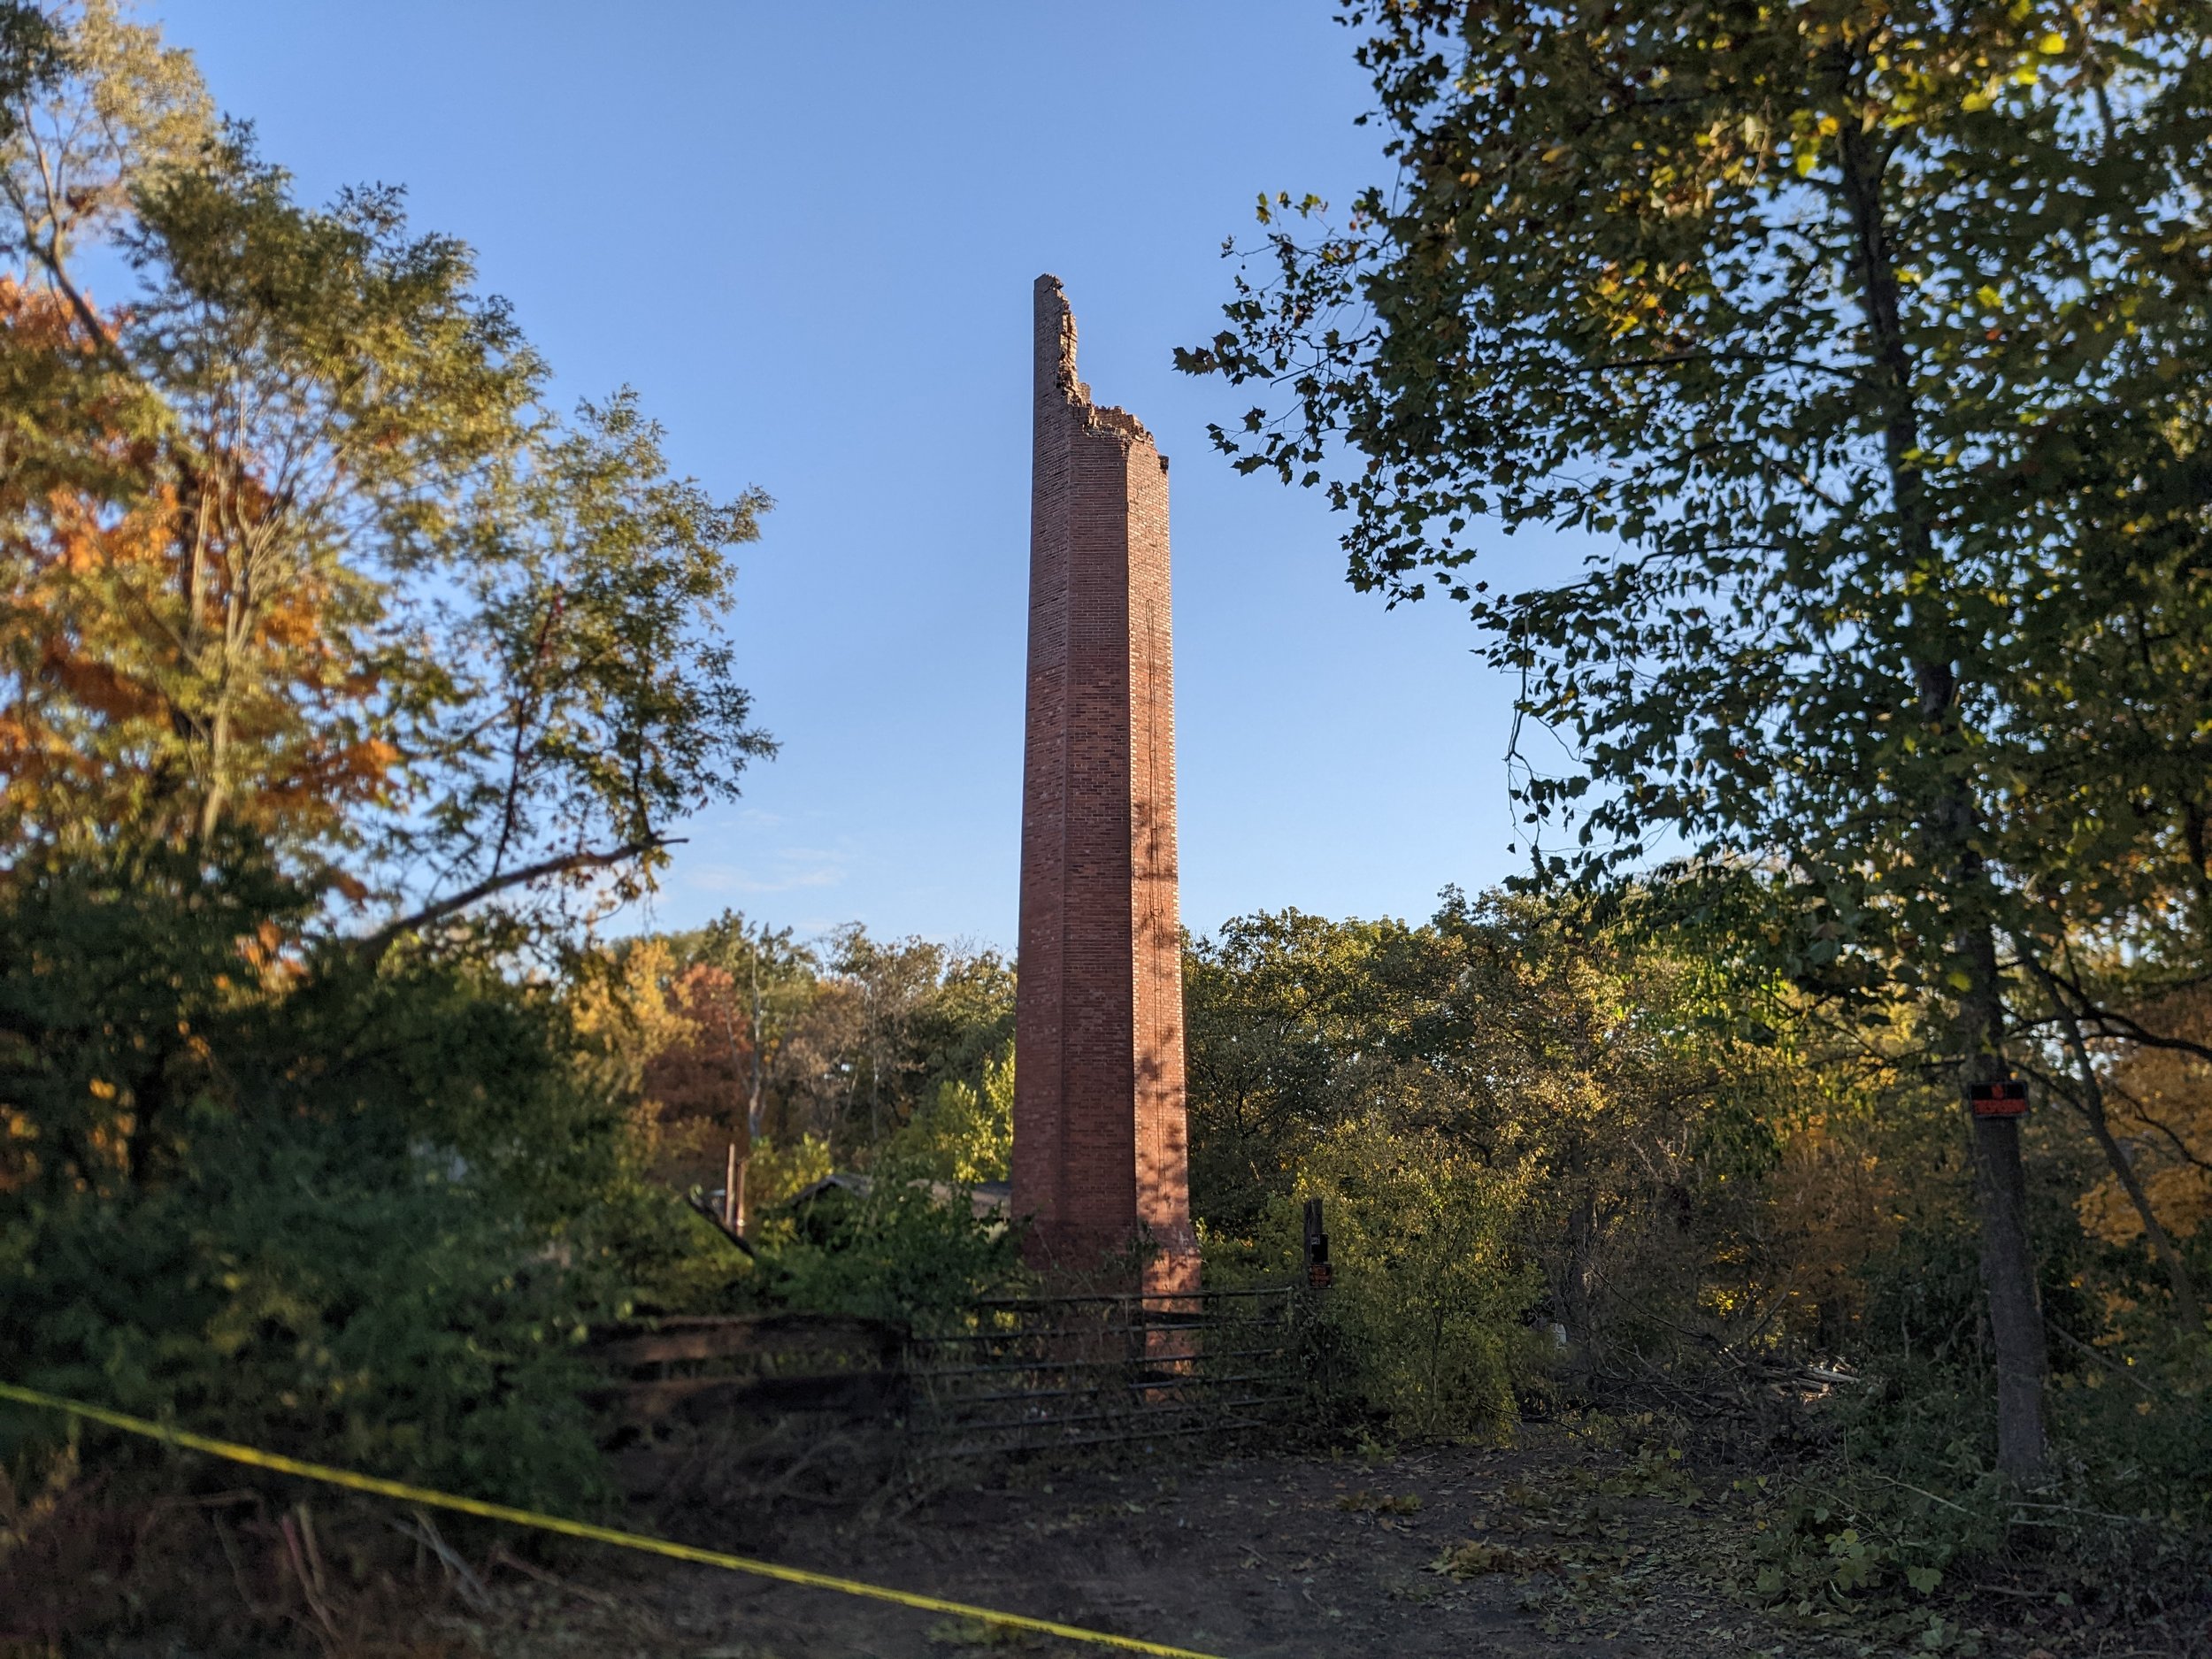
Old power plant razed: Revisiting Morgan’s history, legacy
On Monday, Oct. 10, 2022, the century-old brick tower at the old Antioch College Power Plant was partially torn down by a demolition crew. The former steam plant, which has been defunct for more than 70 years, is being dismantled and the area converted back to its natural state as a spring-fed wetland within the Glen Helen Nature Preserve.
Learn more about the history of the plant, its connection to Agraria via our founder, Arthur Morgan, and its lasting legacy.